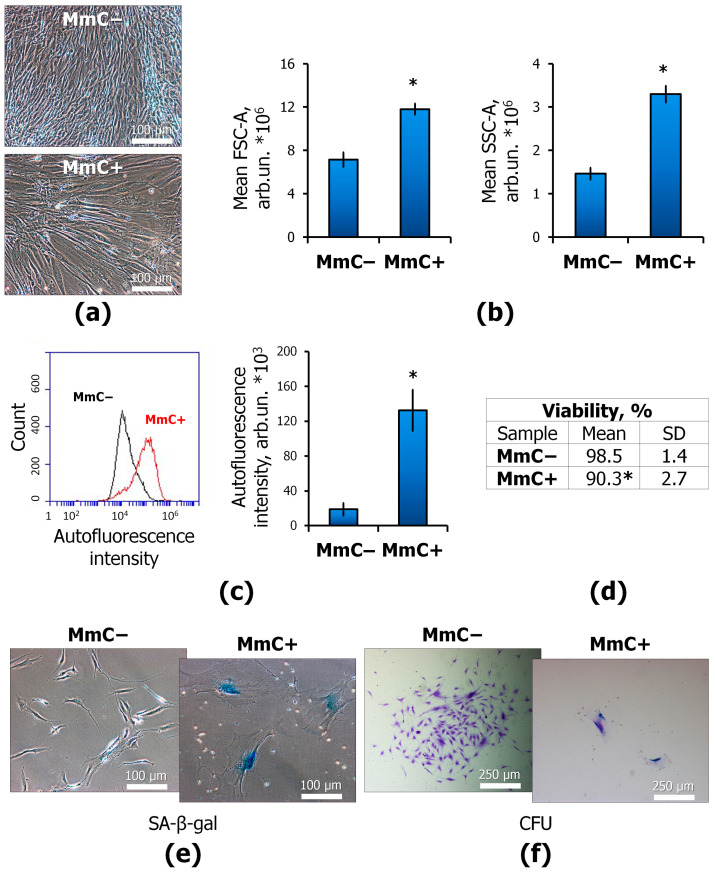
Figure 1.
Senescence markers of MmC-treated MSCs: (a) cell monolayer morphology, and light microscopy; (b) forward scattering (FSCA) and side scattering (SSC-A) to illustrate size and cytoplasm vacuolization of MSCs, respectively, and flow cytometry; (c) autofluorescence intensity, and flow cytometry; (d) cell viability, annexin/propidium iodide (Ann/PI) staining, and flow cytometry; (e) histochemical evaluation of senescence-associated-β-galactosidase (SA-β-gal) activity in MSCs; and (f) colony-forming unit assay, and light microscopy. Data are shown as mean ± SD; n ≥ 4, * p < 0.05. MmC—mitomycin C, MSCs—mesenchymal stem cells.

