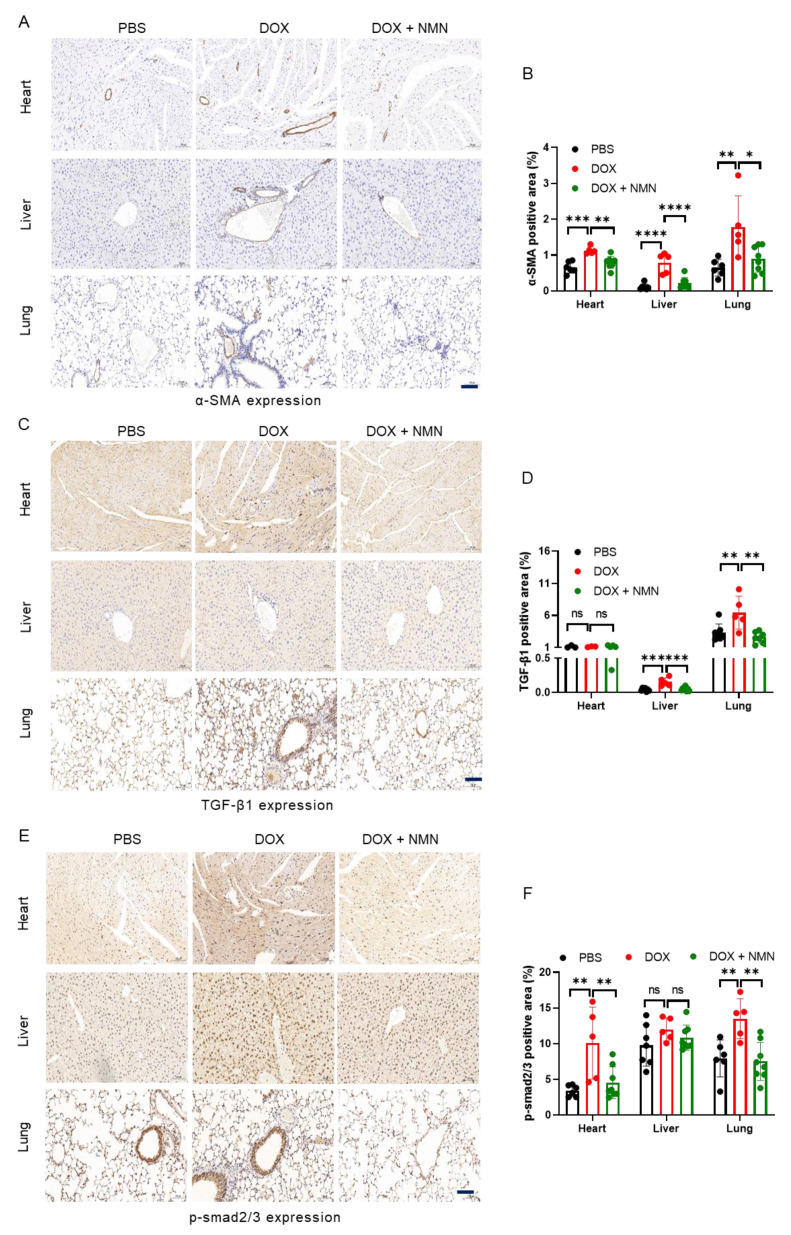
Figure 3.
Effects of NMN on fibrosis in mice exposed to doxorubicin. (A,C,E) Representative immunohistochemistry results for α-SMA (A), TGF-β1 (C) and p-smad2/3 (E) in heart, liver and lungs harvested from week 15. (B,D,F) Bar graphs show α-SMA (B), TGF-β1 (D) and p-smad2/3 (F) positive areas (n = 5–8). Scale bar, 100 μm. Data are shown as means ± standard deviations. Differences of three groups were assessed by one-way ANOVA test (B,D,F). ns, not significant, * p < 0.05, ** p < 0.01, *** p < 0.001, **** p < 0.0001.

