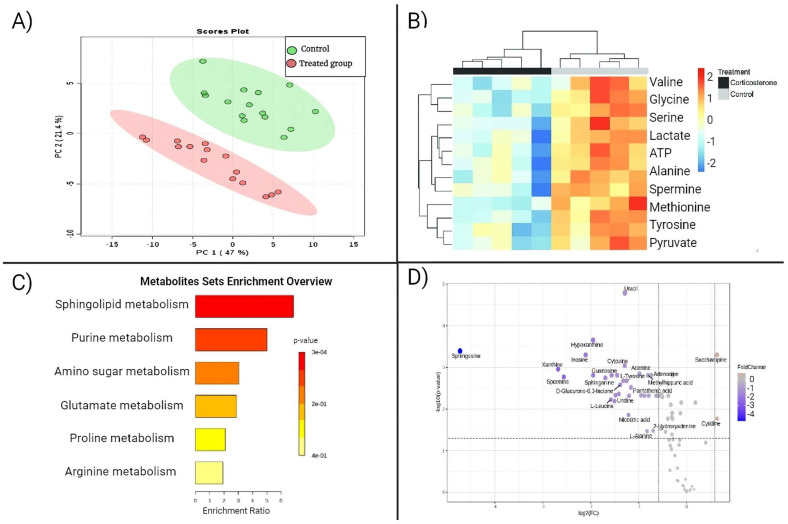
Figure 3.
Some graphical visualization features of MetaboAnalyst 5.0. (A) PCA analysis plot. (B) Heatmap showing the differential metabolites in the statistical analysis function of MetaboAnalyst 5.0. (C) Pathway enrichment overview in MetaboAnalyst 5.0. Color shade is based on the p-value. (D) Volcano plot of a differential analysis in MetaboAnalyst 5.0. Created with BioRender.com.

