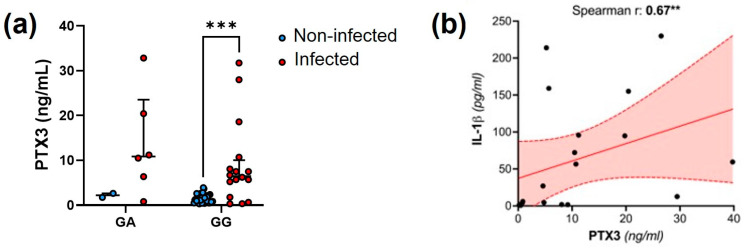
Figure 3.
Genetic and biochemical associations between PTX3 and IL-1β. (a) Distribution of the PTX3 synovial concentration across infected and non-infected patients carrying either the GA or GG genotype of the IL-1β SNP rs2853550. The AA data are not shown because only 1 patient (infected) had this genotype. Two-way ANOVA, *** p < 0.001. (b) Spearman correlation between synovial levels of IL-1β and PTX3. The red area delimited by the dotted lines indicates the 95%CI, and the solid line is the linear regression curve. ** p < 0.01.

