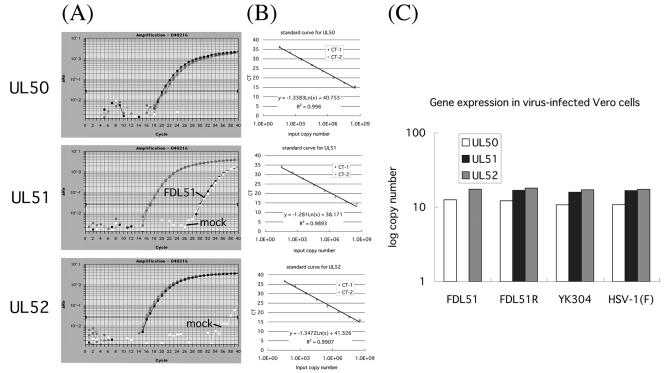
FIG. 3.
Quantitation of gene expression at loci neighboring UL51. (A) Real-time RT-PCR amplification profile of UL50, UL51, and UL52 mRNA in FDL51-infected Vero cells. Data analysis was performed using ABI Prism 7700 sequence detection system software (PE Applied Biosystems), with CT values determined by automated threshold analysis. The fluorescence intensity collected in real time for each sample was plotted against the number of PCR cycles. The black horizontal line represents the threshold setting, set at 10 standard deviations above the baseline. The CT value is defined as the fractional cycle number in which the fluorescence generated within a reaction has crossed the threshold. This value indicates that a sufficient number of amplicons have accumulated to a statistically significant point above the baseline. CT values correlate inversely with target gene expression. To assess relative differences in gene transcript levels, 18S rRNA was used as an RNA control. (B) Standard linear regression for HSV-1 genes. Serially diluted pBS1007 was amplified as described in Materials and Methods. Amplification was detected, and the CT was analyzed by linear regression analysis. The formula and correlation coefficient used are shown in each panel. (C) Log copy numbers of mRNA from UL51-neighboring genes in HSV mutant-infected cells. Shown are average values from two separate experiments in which samples were run in duplicate. Transcript levels from real-time PCR were converted to mRNA copy number.

