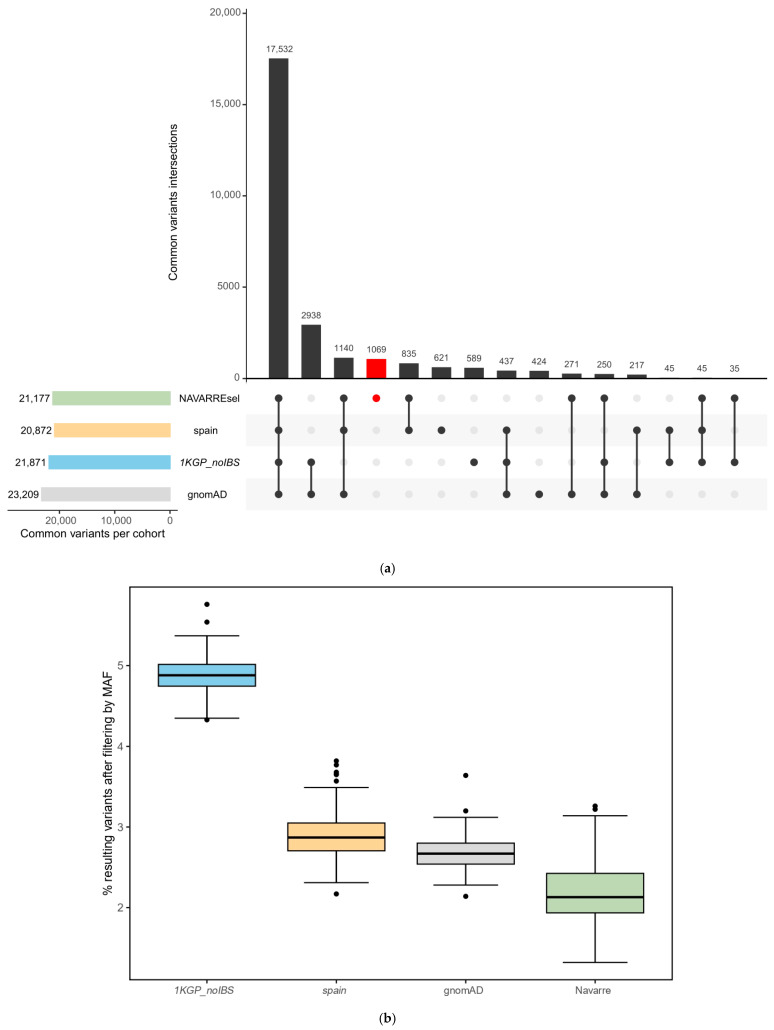
Figure 3.
(a) Upset plot of common variants (MAF > 1%) of each population: NAVARREsel, spain, 1KGP_noIBS, and gnomAD. (b) Resulting percentage of variants per patient (n = 127) after removing common variants from Navarre, spain, gnomAD, or 1KGP_noIBS populations. The box plots represent the median, upper, and lower quartiles with the centre line and box bounds, respectively. Whiskers display the largest and smallest values within 1.5 times the interquartile range from the quartiles. Abbreviations: 1KGP_noIBS, 1000 Genomes Project without Iberian population; gnomAD, Genome Aggregation Database; spain, integration of IBS and MGP populations.

