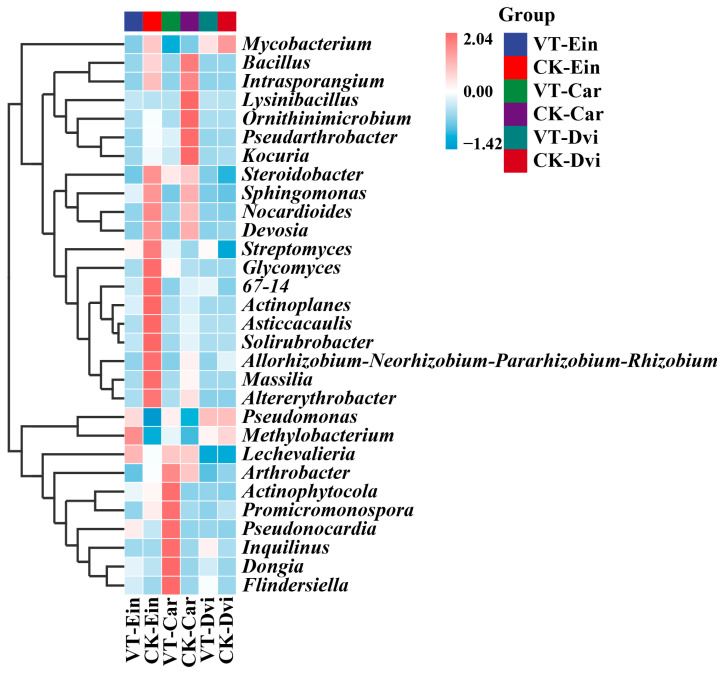
Figure 3.
Heatmap analysis of the 30 genes with the highest abundance of different taxa samples. The relative abundances of different genera are represented by different colors. Blocks, with colors ranging from blue to red indicate an increase in relative abundance. VT-Dvi, D. viscosa in the VTM mining area; VT-Car, Carex in the VTM mining area; VT-Ein, E. indica in the VTM mining area; CK-Dvi, D. viscosa in the non-VTM mining area; CK-Car, Carex in the non-VTM mining area; CK-Ein, E. indica in the non-VTM mining area.

