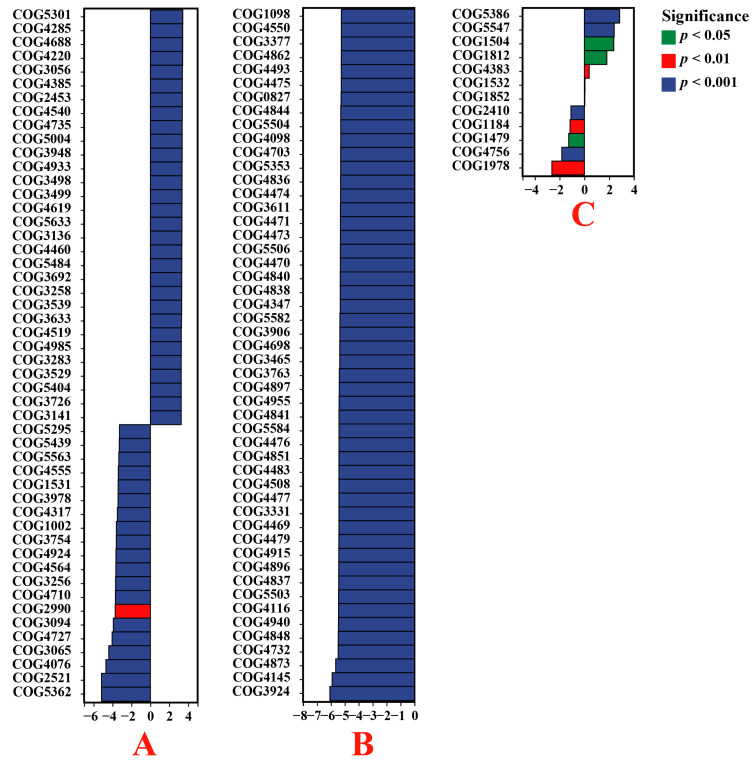
Figure 7.
Based on the COG database, the functions of endophytic bacteria in plant roots were significantly different between VTM mining areas and non-VTM mining areas. The vertical axis represents the ID of the COG, the horizontal axis represents the log2-fold change, and different colors indicate significant differences between samples at different levels. (A) VT-Ein vs. CK-Ein; (B) VT-Car vs. CK-Car; (C) VT-Dvi vs. CK-Dvi.

