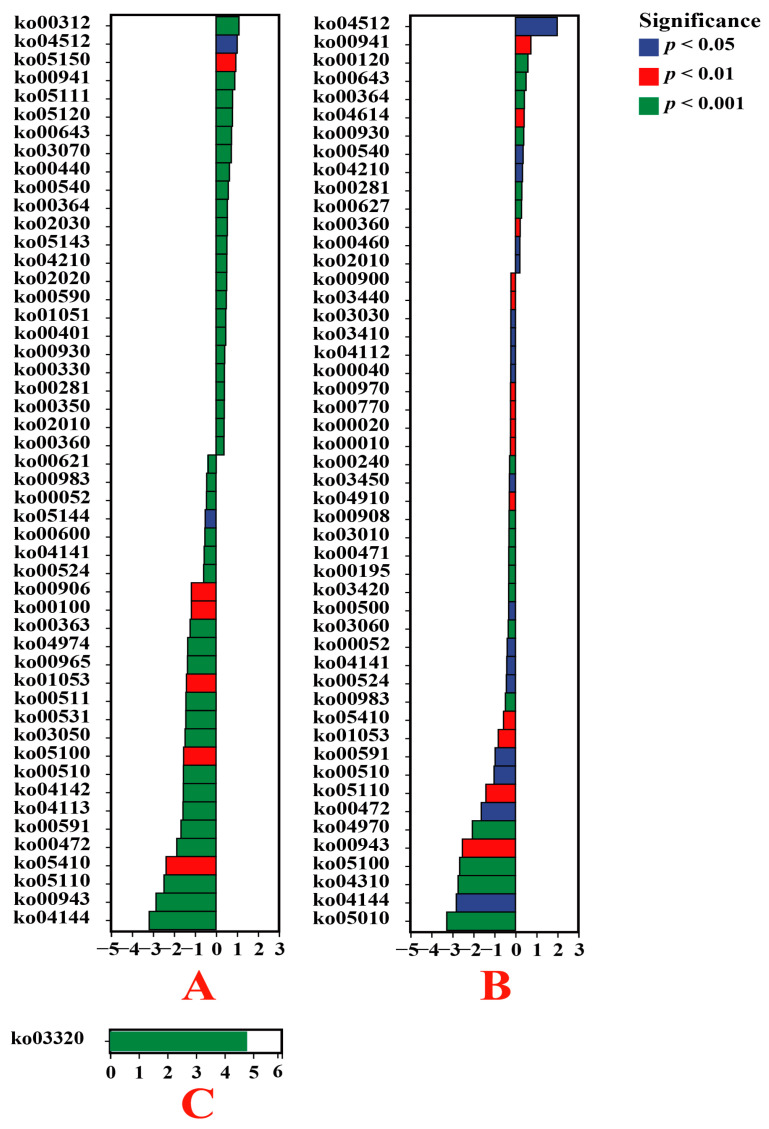
Figure 8.
Based on the KO database, the functions of endophytic bacteria in plant roots were significantly different between VTM mining areas and non-VTM mining areas. The vertical axis represents the ID of the KO, the horizontal value is prelog2 (fold change), and different colors indicate significant differences between samples at different levels. (A) VT-Ein vs. CK-Ein; (B) VT-Car vs. CK-Car; (C) VT-Dvi vs. CK-Dvi.

