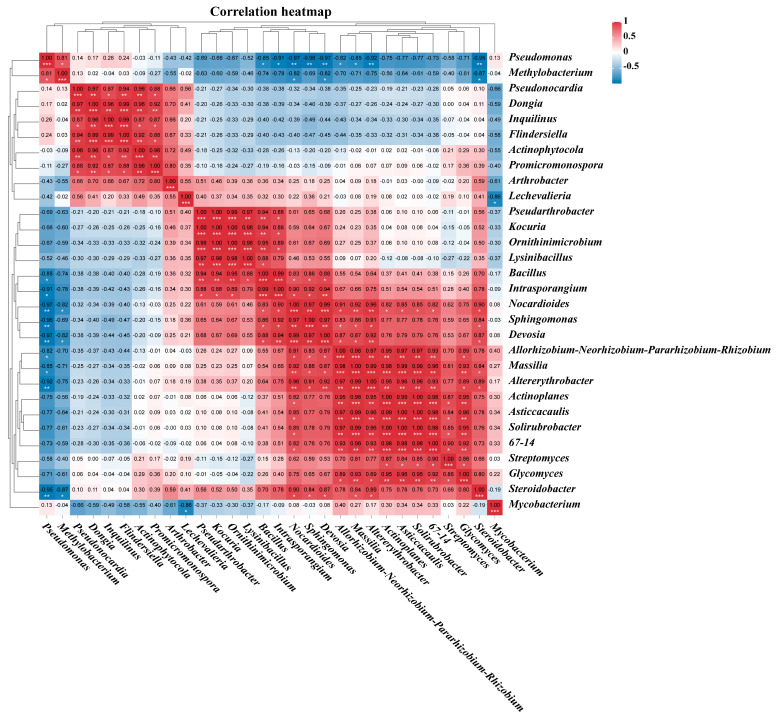
Figure 10.
Pearson correlation analysis between the 30 genes with the highest abundance in different samples. The Pearson correlation index is marked in a square color block, with a blue color block indicating a negative correlation between two bacterial genera and a red color block indicating correlation. One asterisk indicates a significant correlation between two bacterial genera at the p < 0.05 level, two asterisks indicate a significant correlation between two bacterial genera at the p < 0.01 level, and three asterisks indicate a significantly greater correlation at the p < 0.001 level.

