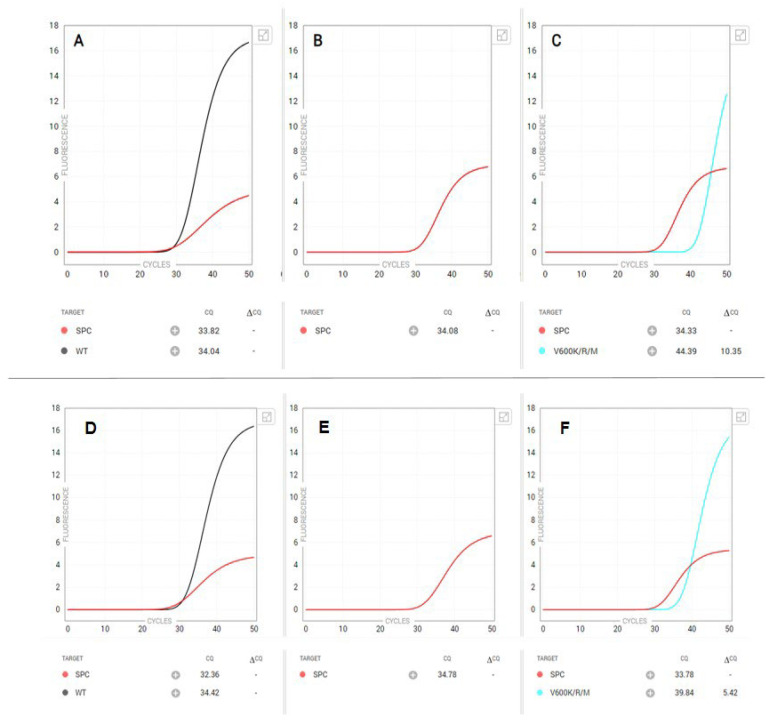
Figure 3.
False-positive Idylla BRAF PCR amplification curves. The top panel shows (A) the PCR amplification curve for wild-type BRAF, (B) a negative result for a BRAF V600E/E2/D variant, and (C) a substantially delayed amplification curve in the V600K/R/M channel. NGS on this FFPE specimen identified a BRAF c.1789_1790delCTinsTC (p.Leu597Ser) variant at a VAF of 29%, along with mutations in ALK and FGFR3. The bottom panel displays (D) the PCR amplification curve for wild type BRAF, (E) a negative result for a BRAF V600E/E2/D variant, and (F) late normal amplification in the V600K/R/M channel. NGS on the same FFPE specimen identified a BRAF c.1797_1798insACA (p.Thr599dup) variant at a VAF of 53%.

