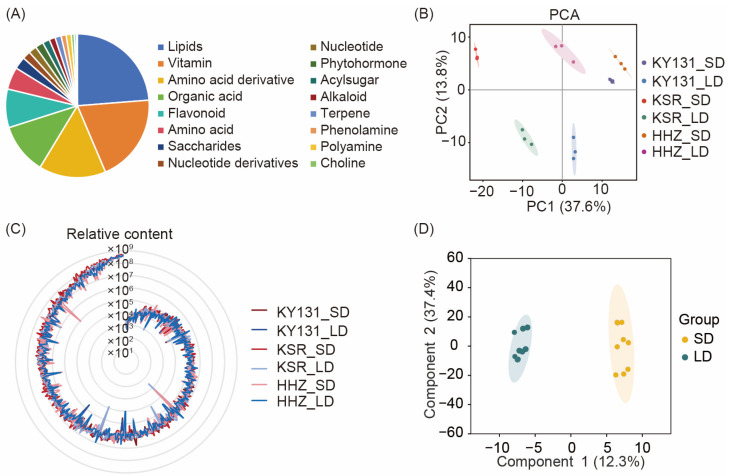
Figure 1.
Metabolite determination based on rice grains harvested under different photoperiods (short-day, SD and long-day, LD). (A) 438 metabolites were identified in rice grains and classified into 16 categories based on the properties of the compounds. The measured metabolites are classified according to different categories and labeled with different colors, and their proportions are also listed. (B) Principal component analysis (PCA) of metabolites of three different varieties (KY131, HHZ, and KSR) under different photoperiods (SD and LD) showed good data repeatability. The circle represents a 95% confidence interval. (C) Overview of the relative metabolite content determination in rice grains under different photoperiods. The average values of metabolite content were utilized for ranking and a radar chart was used to show the relative metabolite content of different varieties under SD and LD conditions. The metabolite content under SD conditions are represented by red lines, while blue lines represent metabolites content under LD conditions. The higher the Y-axis value at which the outermost line is situated, the greater the level of metabolite content. The relative content of metabolites refers to the peak area of the metabolite peak graph. (D) Orthogonal partial least-squares discriminant analysis (OPLS-DA) of metabolites under different photoperiods (SD and LD). The circle represents a 95% confidence interval.

