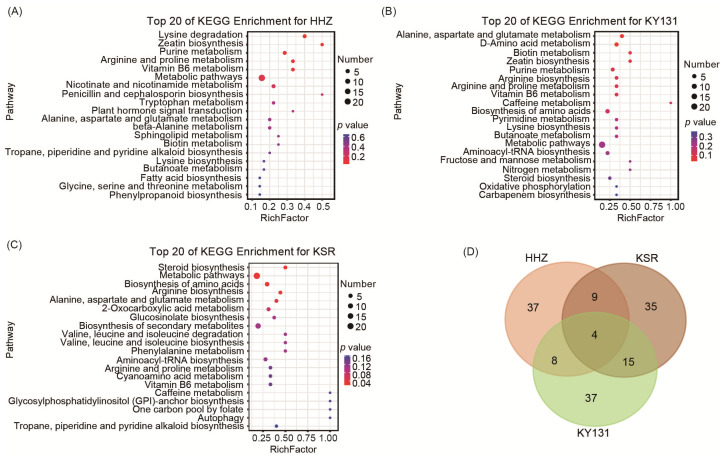
Figure 3.
Differential metabolite analysis of HHZ, KY131, and KSR under different photoperiods. (A) The Kyoto Encyclopedia of Genes and Genomes (KEGG) analysis of DAMs under LD and SD conditions for HHZ. (B) KEGG analysis of DAMs under LD and SD conditions for KY131. (C) KEGG analysis of DAMs under LD and SD conditions for KSR. The size of the circle represents the quantity of enriched metabolites, with a deeper red color indicating higher significance. (D) Veen plot reveals the intersection and differences of DAMs among three varieties under different photoperiods. The overlapping portions indicate the number of differential metabolites identified among two or three varieties.

