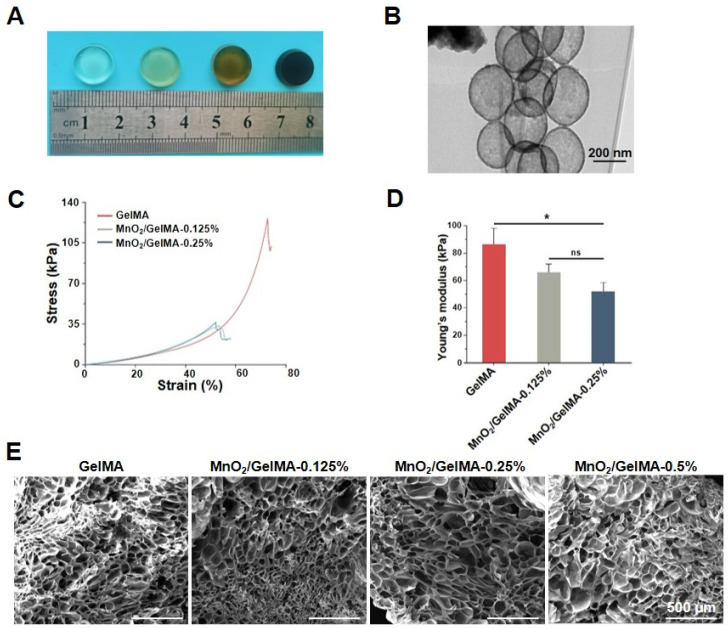
Figure 1.
Characterizations of MnO2/GelMA composite hydrogels. The gross morphology of the composite hydrogels is displayed (A). The morphology of MnO2 (B) was observed by using transmission electron microscopy (TEM). Compressive stress–strain curves (C) and Young’s modulus (D) of the GelMA composite hydrogels with different MnO2 concentrations were analyzed via compression test, and the morphology of the MnO2/GelMA composite hydrogels (E) was observed using scanning electron microscopy (SEM). Data are presented as mean ± SD (n = 3). ns p > 0.05; * p < 0.05, versus hydrogels without MnO2 (GelMA) (D). Representative images are shown. Scale of TEM images = 200 nm (B) and scale of SEM images = 500 μm (E).

