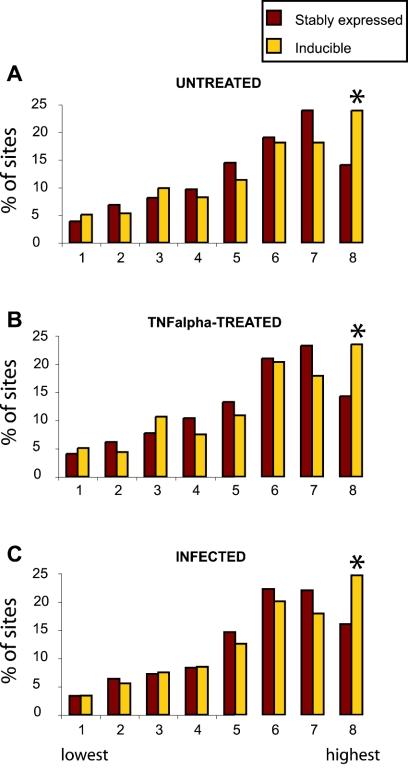
FIG. 4.
Inducible proviruses are found more commonly in very highly active genes. Expression levels were assayed in Jurkat cells (three independent Affymetrix HU133A microarrays for each condition) and scored using the Affymetrix Microarry suite 5.1 software package. To classify the expression levels of genes hosting integration events, class boundaries were first generated by dividing all the genes on the array into eight classes according to their relative level of expression. Genes that hosted integration events were then distributed into the classes defined by these boundaries, summed, and expressed as a percentage of the total number of integration sites in genes on the array. The leftmost class in each panel contains the 1/8 most weakly expressed genes, and the rightmost class contains the 1/8 most highly expressed. The highest signal value represented in each expression bin (for untreated Jurkat cells) was as follows: bin 1, 9.2; bin 2, 20.6; bin 3, 38.6; bin 4, 66; bin 5, 117; bin 6, 227; bin 7, 488; bin 8, 12050. Integration sites were analyzed using data from untreated Jurkat cells (A), TNF-treated Jurkat cells (B), or HIV-Tat-GFP-infected Jurkat cells (C) (P < 0.003; chi-square test). Inducible proviruses in the eighth class (most highly expressed) accounted for about 17% of the total.

