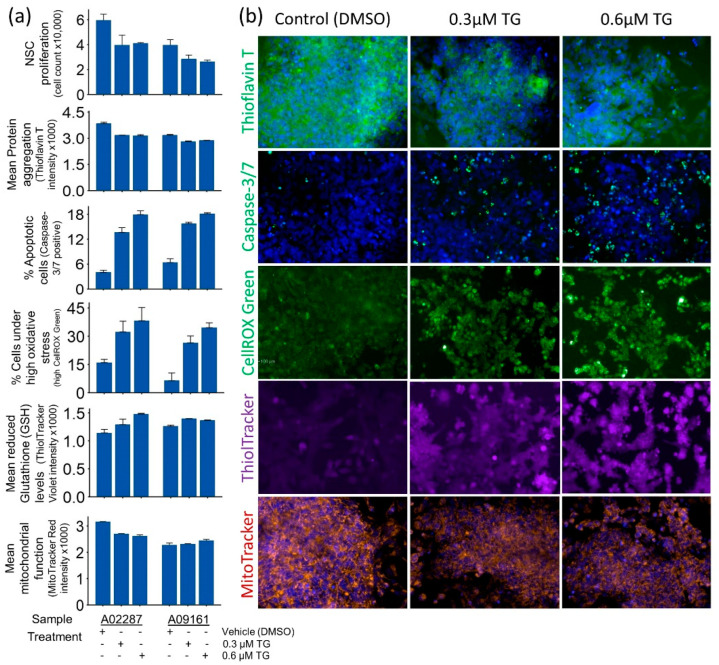
Figure 2.
Quantitative measures of cellular homeostasis in control and ER stress-challenged NSCs. (a) Bar plots of cell proliferation, protein aggregation, apoptosis, generalized oxidative stress, reduced glutathione (GSH), and functional mitochondria in vehicle-treated controls and ER stress-challenged NSCs. (b) Representative cytochemistry images of cellular phenotypes quantified in panel (a). All images were obtained using a 20× long-working-distance objective on a PerkinElmer Operetta high-content screening system.

