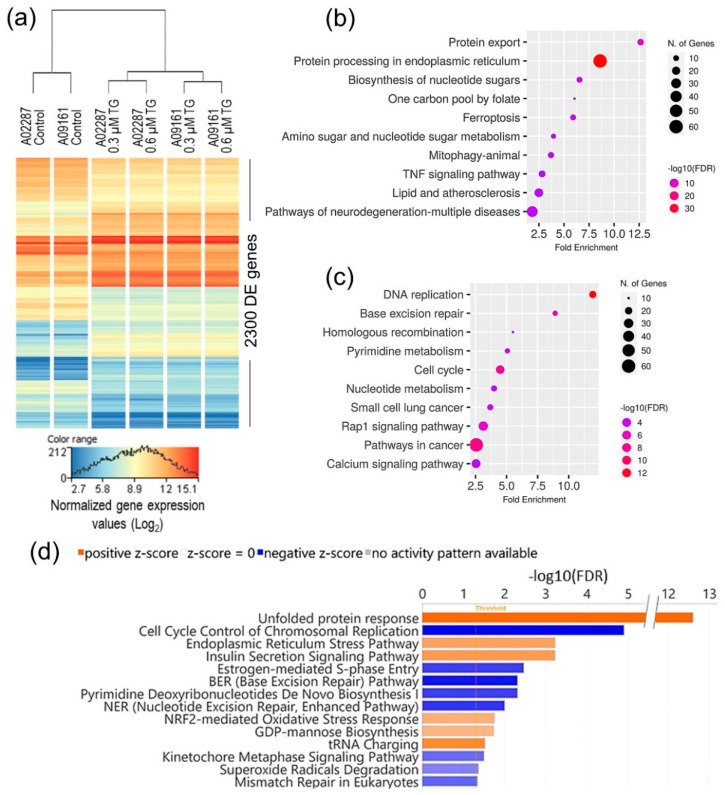
Figure 3.
Transcriptomic analysis of NSCs’ ER stress response. (a) Heatmap of 2300 genes, which were significantly differentially expressed between control and ER stress-challenged NSCs. (b,c) Top 10 KEGG pathways, which were significantly enriched in upregulated and downregulated DE genes, respectively. (d) IPA canonical pathways, which were significantly enriched (FDR-corrected p-value ≤ 0.05), and differentially regulated (activation absolute z-score ≥ 2.0) in ER stress-challenged NSCs.

