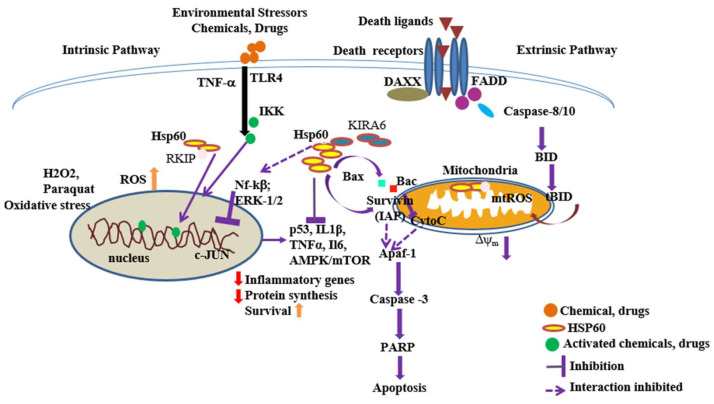
Figure 3.
The diagram depicts the intricate interplay between HSP60 and various cellular proteins, such as p53, Nf-kβ, IKK, Bax, and survivin, influencing critical cellular processes like tumorigenesis, metastasis, inflammation, and apoptosis regulation. It illustrates how diverse stressors and stimuli, both chemical and physical, trigger downstream signaling pathways that govern protein-folding and cell-death mechanisms. Ultimately, mitochondrial dysfunction and compromised membrane integrity lead to the initiation of apoptosis-mediated cell death. The colored symbols represent interactors: orange circles, chemical stressors and drugs; green circles, activated molecules bind to DNA; marron triangles, death ligands; violet circles, fas-associated protein death domain; sky blue ovals, caspase-8; green box, BAX; red box, BAK [5].

