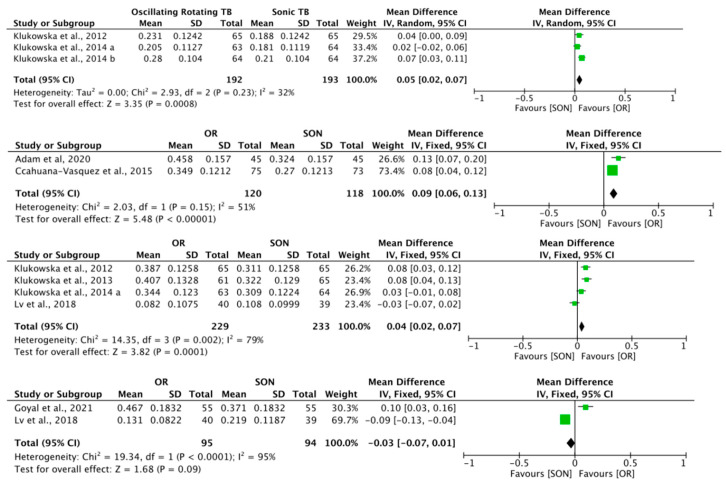
Figure 3.
Forest plots of follow-up periods at 6, 8, 12 and 24 weeks. OR: oscillating–rotating TB; SON: sonic TB. Green boxes represent the study results. Horizontal line represents the 95% confidence interval. Diamonds represent the average of the studies within each subgroup [27,28,29,30,31,32,33,34].

