Figure 8.
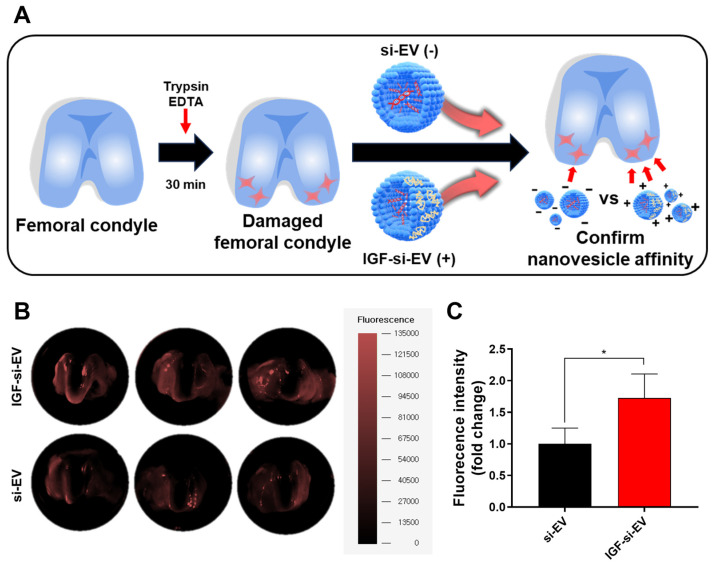
The ex vivo study to compare nanovesicle affinity: (A) the illustration of ex vivo model system to mimic the OA model and the nanovesicle affinity test with extraction of damaged knee cartilage; (B) the image of nanovesicle affinity with damaged femoral condyle imaged with fluorescence-labeled organism-bioimaging instrument (FOBI); (C) the graph of the analyzed fluorescence intensities. (Values are presented as mean ± SD (n = 3), and statistical significance was obtained with one-way analysis of ANOVA with Tukey’s multiple comparison post-test (* p < 0.05).)

