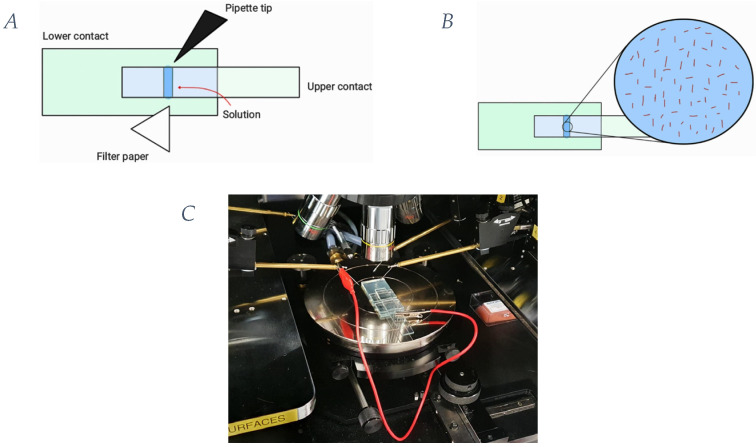
Figure 6.
Experimental setup of the device configuration used to measure the impedance properties of actin filaments compared to the background. (A) Schematic representation of the device used. (B) Focus on the schematic representation of the actin filaments in solution in the perfused chamber of measurement. (C) Keithley 4200-semiconductor characterization system with Signatone probe station setup.

