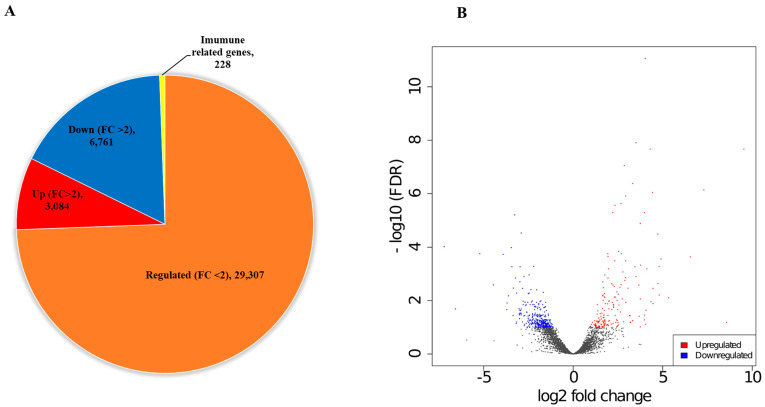
Figure 2.
De novo transcriptome analysis of nematode-infected Deroceras reticulatum. A pie diagram of differentially expressed genes in nematode infected slug as compared to the uninfected slug. In the total number of regulated unigenes (39,380), genes with low log2 fold changes (FC < 2) are 29,307 (orange), 3084 genes are upregulated (red) and 6761 genes are downregulated (blue), with FC > 2 (A). Volcano plots of DEGs showing the distribution of gene expression plotted by FC > 2 for each gene in the nematode-infected slug compared to the control slug group. Red dots indicate upregulated genes, and blue dots indicate downregulated genes (B).

