Figure 1.

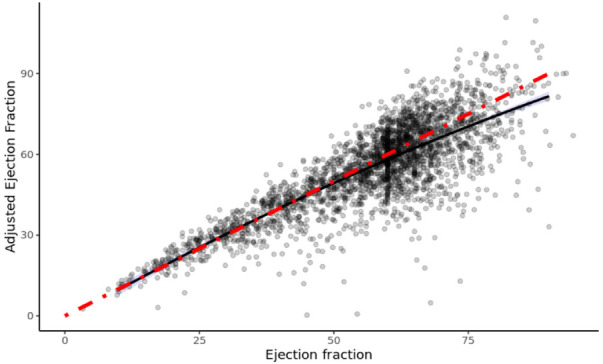
Efa versus EF of all patients in study. The red line denotes a 1:1 gradient relationship, while the black line denotes the least-square linear tail-restricted cubic spline regression line (overlapped with quadratic polynomial).

Efa versus EF of all patients in study. The red line denotes a 1:1 gradient relationship, while the black line denotes the least-square linear tail-restricted cubic spline regression line (overlapped with quadratic polynomial).