Figure 3.
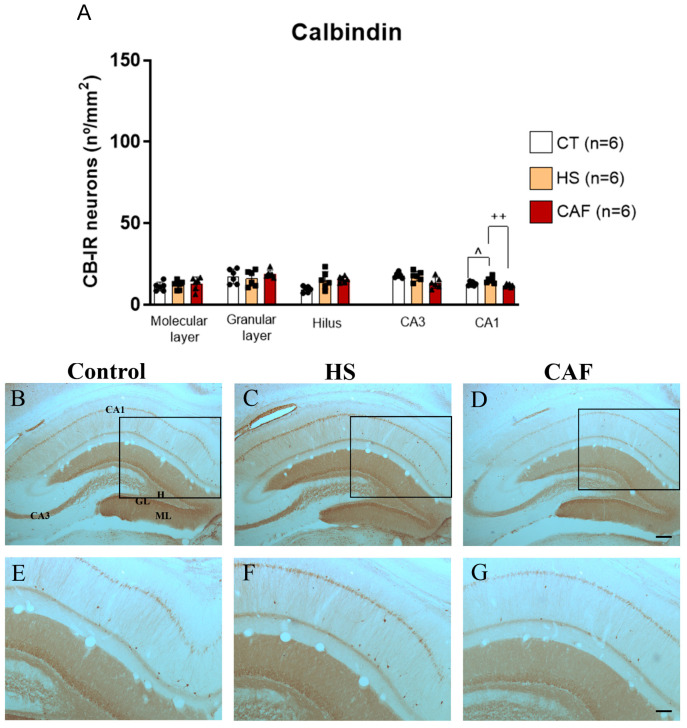
Histogram (A) showing the mean ± SD areal density of CB-IR cells in the DG, CA3, and CA1, with 6 animals per group. Circles represent the value for each animal in the control group, squares represent the value for each animal in the HS-treated group, and triangles represent the value for each animal in the CAF-treated group. The HS diet induced a significant increase in the areal density of CB-IR cells in the CA1 region compared to control and CAF-treated rats. ^ p < 0.05, HS-treated versus control rats; ++ p < 0.01, HS-treated versus CAF-treated rats. CT, control; HS, high-sugar; CAF, cafeteria. Representative photomicrographs of coronal sections through the HF of control (B,E), HS- (C,F), and CAF-treated (D,G) rats immunostained for CB. The boxes drawn in (B), (C), and (D) delineate approximately the regions of the CA1 area shown at higher magnification in (E), (F), and (G), respectively. High-power photomicrographs of the CA1 of control (E), HS- (F), and CAF-treated (G) rats. ML, molecular layer; GL, granule cell layer; H, dentate hilus; CA3, pyramidal cell layer of CA3 hippocampal field; and CA1, pyramidal cell layer of CA1 hippocampal field. Scale bar: 200 µm in (B–D) and 100 µm (E–G).

