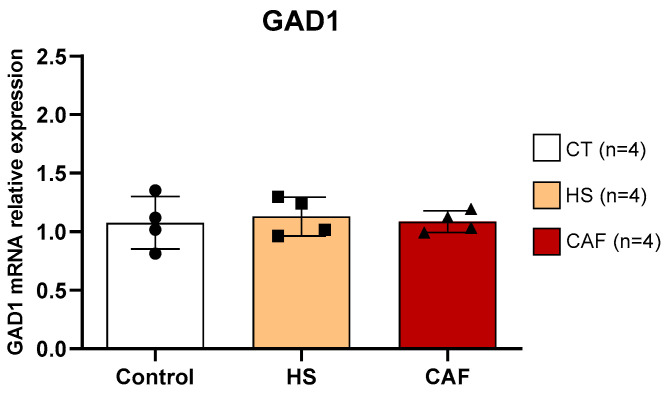
Figure 7.
Hippocampal GAD1 mRNA expression relative to the mean of the housekeeping gene GAPDH/β-actin. Data are expressed as the mean ± SD, with 4 animals per group. The circles represent the value for each animal in the control group, squares represent the value for each animal in the HS-treated group, and triangles represent the value for each animal in the CAF-treated group. CT, control; HS, high-sugar; CAF, cafeteria.

