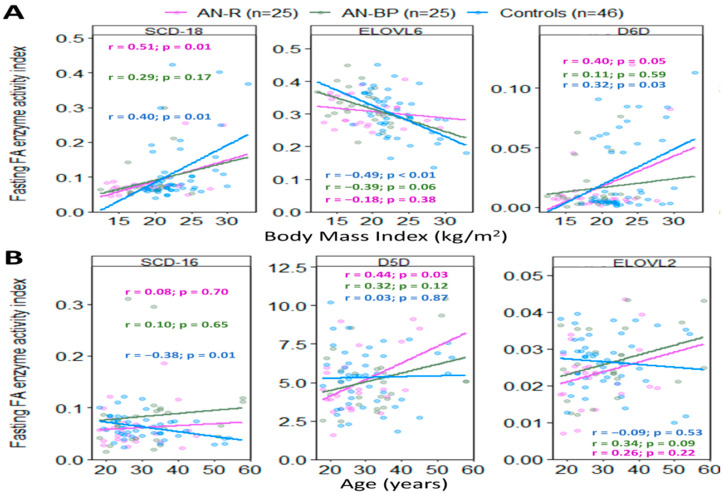
Figure 8.
Pearson’s correlations of BMI (A) and age (B) with fasting enzymes in restricting AN subtype (purple), binging and purging AN subtype (green), and controls (blue). Colored dots and solid lines represent individual data points and the slopes of relationships, respectively. r and p indicate Pearson’s correlation coefficient and p-value. AN-R: restricting anorexia nervosa subtype; AN-BP: binging and purging anorexia nervosa subtype; SCD18: stearoyl-CoA desaturase-18 (oleic acid/stearic acid); D6D: delta-6-desaturase (gamma-linolenic acid/linoleic acid); D5D: delta-5-desaturase (arachidonic acid/dihomo-gamma-linolenic acid); ELOVL6: elongase-6 (stearic acid/palmitic acid); ELOVL2: elongase-2 (adrenic acid/arachidonic acid).

