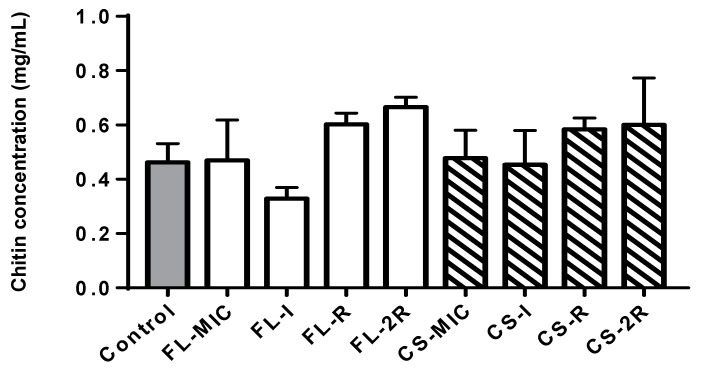
Figure 2.
Chitin content. The grey bar represents the control strain that was not grown in any concentration of drugs. White bars represent the isolates that were grown in increasing concentrations of fluconazole. The striped bars represent the isolates grown in increasing concentrations of caspofungin. Values of chitin concentration in 100 mg of weight pellet were used. Statistical significance was calculated using Friedman and Dunn’s multiple comparisons tests where the p-value of fluconazole isolates is 0.004 and that for caspofungin is p = 0.4056.

