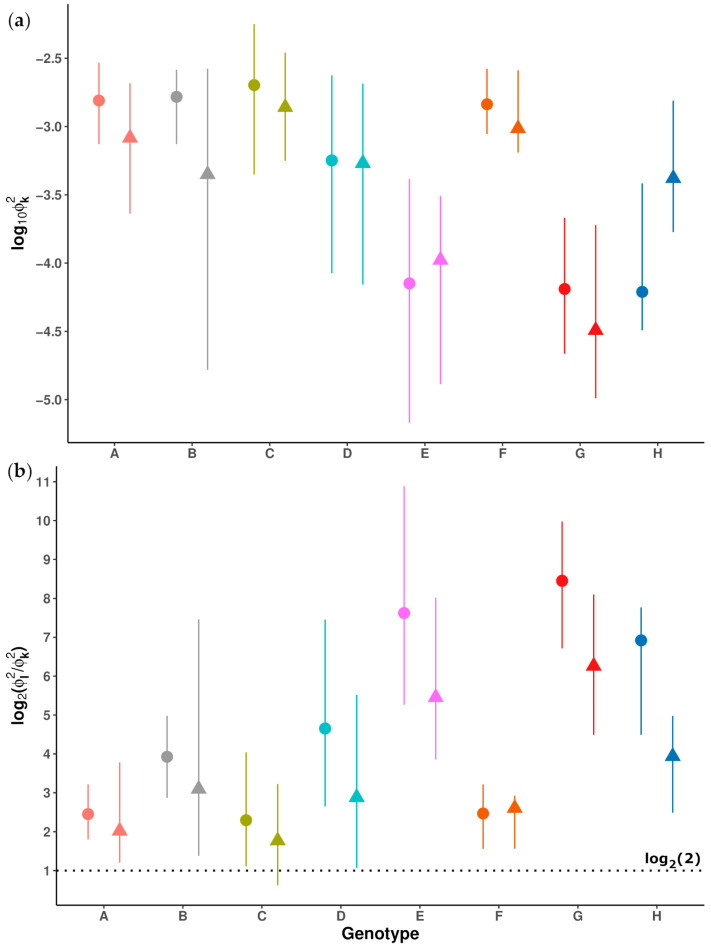
Figure 1.
Summaries of the proximity function values from the reference sequences to their respective genotypes. Median values correspond to circles (preS) and triangles (5X), while minimal and maximal values are indicated by the lowest and the highest ends of lines crossing circles and triangles, respectively: (a) Base-10 logarithm of minimal, median and maximal lowest proximity functions values (); (b) Base-2 logarithm of minimal, median and maximal ratios between the two lowest proximity function values (). The safety threshold of 2 for classifying a sequence into a given genotype is denoted by a dotted black line in the graph.

