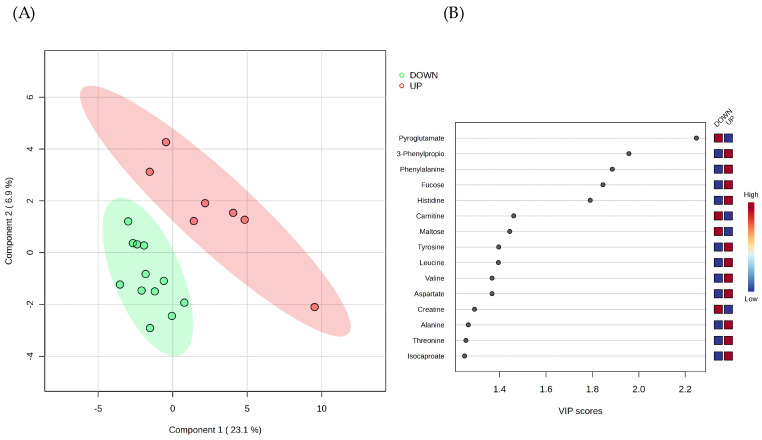
Figure 2.
Supervised multivariate analysis of the salivary metabolite datasets. (A) Partial Least Squares–Discriminant Analysis (PLS-DA) scores plot of whole saliva metabolomes. The classification model separates the DOWN (FMBS < 3.75%) from the UP (FMBS > 3.75%) salivary metabolomes. Components 1 and 2 account for 23.1% and 6.9% of the variance, respectively, and colored ellipses represent each cluster’s 95% confidence region. (B) Metabolite ranking (top 15 metabolites) according to the Variable’s Importance in Projection (VIP) scores, resulting from PLS-DA component 1. The higher the VIP score of a variable, the better its ability to discriminate between groups. Variables with a VIP score close to or greater than 1 are considered relevant [31]. The blue and red boxes on the right denote the relative metabolite abundance in the two clusters.

