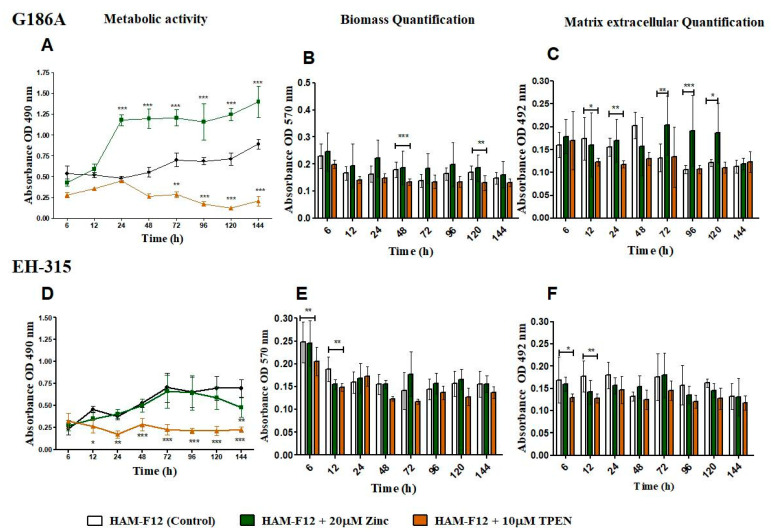
Figure 2.
Characterization of biofilm growth of G186A and EH-315 strains of H. capsulatum in control medium (control), medium with zinc (Zinc), and medium with TPEN (TPEN). Assay of reduction in metabolic activity by the XTT method for G186A (A) and EH-315 (D) strains. Quantification of biomass production by crystal violet assay for strains G186A (B) and EH-315 (E). Extracellular matrix quantification by safranin for G186A (C) and EH-315 (F). Error bars indicate standard deviations. The p values (* p < 0.05, ** p < 0.01, *** p < 0.001) were calculated by comparing the experimental conditions of the addition of zinc and TPEN with the control (HAM-F12). Line color black—control (HAM-F12); line color green—HAM-F12 + zinc and line color orange—HAM-F12 + TPEN.

