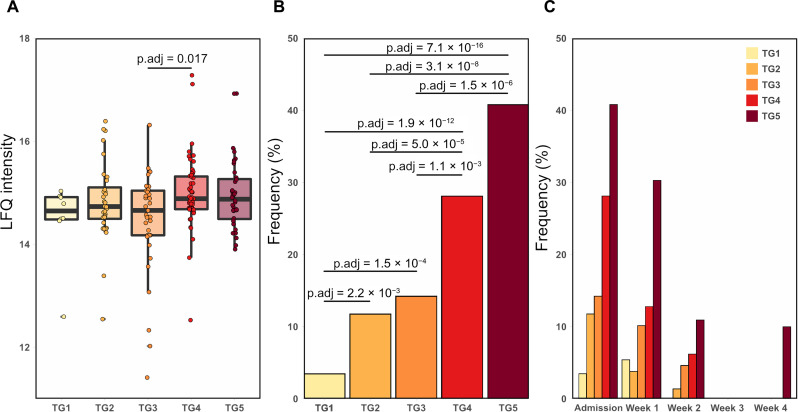
Fig. 2. Frequency of detection of SARS-CoV-2 NP in plasma was associated with COVID-19 severity.
(A) Boxplot of the Label-free quantification (LFQ) intensity of the N protein at admission. We performed a one-way analysis of variance (ANOVA) and found statistical differences with an adjusted P value of 0.034. A post hoc test was done, a statistical difference was found between TG3 versus TG4 (P value = 0.0172). (B) Frequency of SARS-CoV-2–derived NP at admission to the hospital for each TG. The frequency of NP detection for each TG was as follows: TG1 had 3% (8 of 230), TG2 12% (32 of 272), TG3 14% (37 of 260), TG4 28% (56 of 199), and TG5 41% (40 of 98). We applied a Fisher’s exact test to assess statistical differences between TGs. Frequency NCAP: statistically highly significant TG1/TG2 (Padj = 2.2 × 10⁻³), TG1/TG3 (Padj = 1.5 × 10⁻⁴), TG1/TG4 (Padj = 1.9 × 10⁻¹²), TG1/TG5 (Padj = 7.1 × 10⁻¹⁶), TG2/TG4 (Padj = 5.0 × 10⁻⁵), TG2/TG5 (Padj = 3.1 × 10⁻⁸), TG3/TG4 (Padj = 1.1 × 10⁻³), TG3/TG5 (Padj = 1.5 × 10⁻⁶). (C) Frequency of SARS-CoV-2–derived NP at admission to the hospital, week 1, week 2, week 3, and week 4 for each TG. At week 4, the NP was only observed in one individual belonging to TG5. No NP was observed after 4 weeks of hospitalization.

