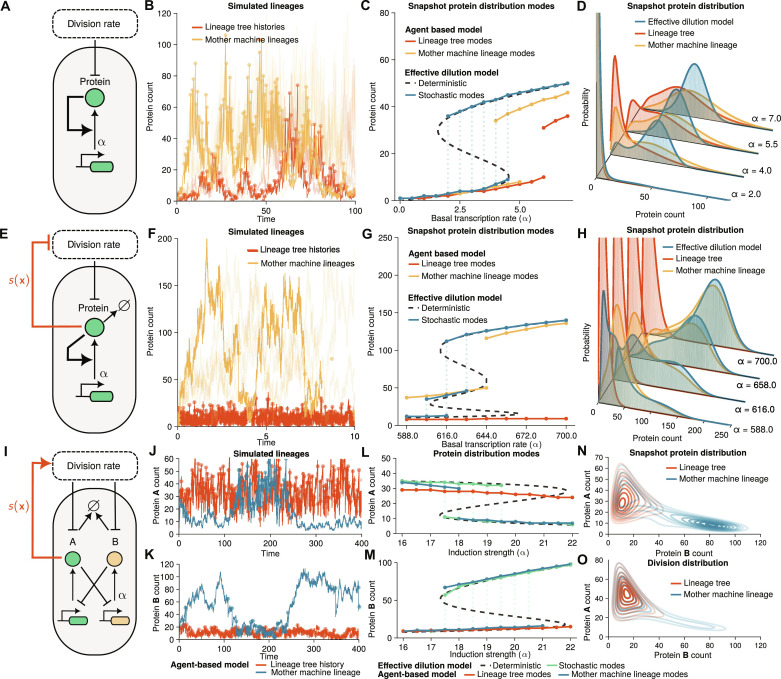
Fig. 3. Selection reinforces lineage decisions in cellular switches.
(A to D) Agent-based model of transcriptional feedback. (A) Illustration of the transcriptional feedback model where protein expression promotes its production with parameter α corresponding to a basal transcription rate. Proteins are partitioned binomially at cell division. (B) Agent-based simulations of lineage tree histories and mother machine lineages (α = 4.0) obtained using the first division algorithm (see Materials and Methods) display switching between low– and high–protein expression states. Individual cell divisions are shown as dots to indicate the timescale of cell divisions. (C) Modes (local maxima) of the snapshot protein distributions. FSP solutions of the agent-based model predict bimodal distributions of mother machine (orange) and lineage trees (red) over intermediate basal production rates. The EDM (black and blue) agrees well with the mother machine solution. (D) FSP solutions show a transition from unimodal to bimodal distributions. (E to H) Agent-based model with transcriptional and growth feedback [s(x) = k2/((x/K2)4 + 1)] where protein synthesis inhibits division rate and promotes its own production rate. EDM and mother machine lineages have three stable modes, while lineage trees show that fast-dividing cell lineages take over the population. (F) Agent-based simulations of mother machine lineages (basal transcription rate α = 644.0) show switching between low and high protein levels, while, in lineage tree histories, the fast-dividing lineages determine the cell fate. (I to O) Agent-based model of the genetic toggle switch. Induction strength α corresponds to the maximal transcription rate of protein B. Protein A is under selection via selection function of the form s(x) = k3/((K3/xA)2 + 1). (N to O) Snapshot and division protein distribution display multimodality and a long tail, respectively, in the mother machine lineages (blue, α = 18.9). The fast-dividing subpopulation is selected in the lineage trees (red). Parameters and model details in section S3 (B and C).

