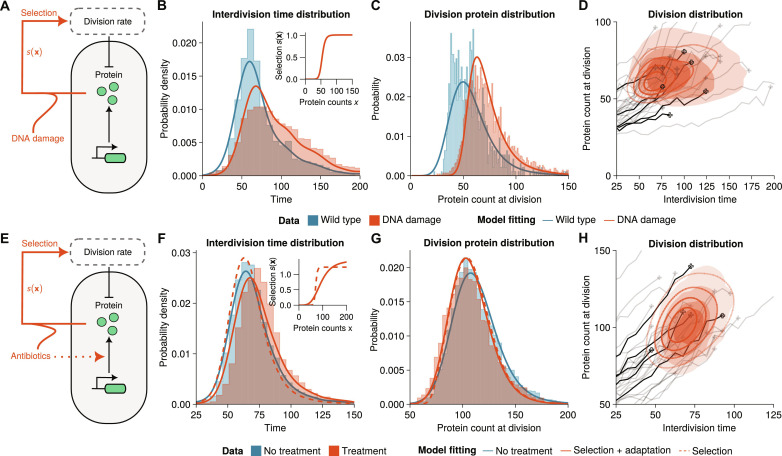
Fig. 4. Inference of selection effects in E. coli cells.
(A) Agent-based model of the SOS response involves a bursty gene expression model with an age-dependent division rate and binomial partitioning at cell division. DNA damage is induced through a gene expression–dependent modulation of the division rate. (B and C) Interdivision time and protein distributions from the mother machine lineages [fluorescent reporter, medium growth conditions; (47)] in unstressed (blue area) and damage-induced mother machine lineages (red area) are well fit by the agent-based model (m = 1; see section S4B for fit parameters). The inset shows the selection function s(x) obtained in damage-induced conditions. (D) The division distribution of the fitted model shows a distinctly peaked distribution (red lines) that compares well with the experimental distribution (red-shaded area) and single-cell traces of the data (representative traces shown in black and gray). (E) Agent-based model of antibiotic resistance gene expression using a bursty gene expression model with age-dependent division rate. Antibiotic treatment response involves positive feedback of protein expression and division through a gene expression–dependent division rate and adaption of gene expression parameters. (F and G) Statistics of the division distribution of the lineage trees [fluorescent fusion-protein genome-integrated reporter; (36)] in untreated (blue area) and antibiotic-treated cells (red area). Lineage tree data is well fitted by the agent-based model combining drug-dependent selection and adaptation (red solid line), but not using selection alone (red dashed line, m = 2, parameters in section S4B). The inset shows the corresponding selection functions s(x) obtained in treated conditions. (H) The division distribution under treatment shows a peaked distribution (red lines) that compares well with the experimental distribution and single-cell traces of the data (representative traces shown in black and gray).

