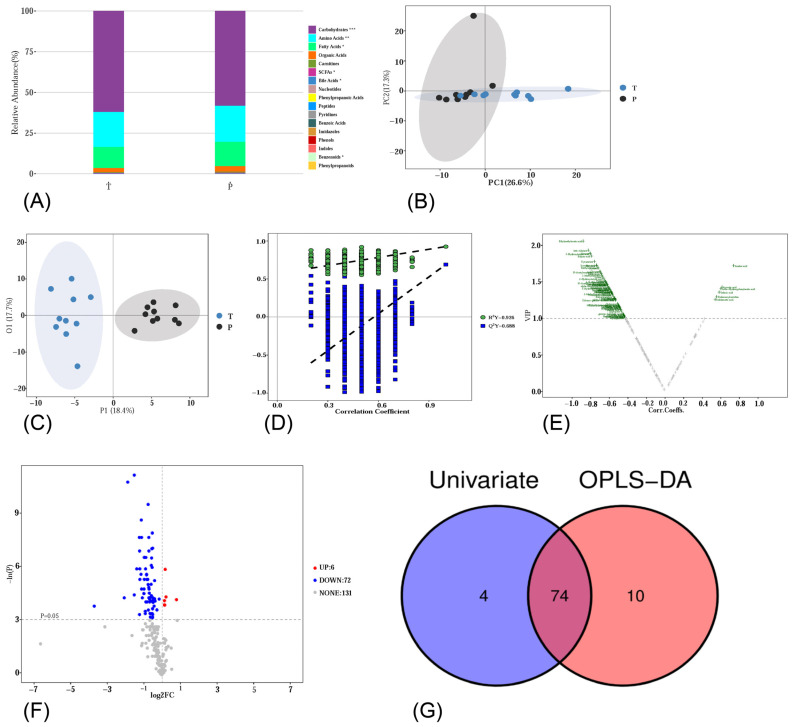
Figure 2.
(A) Relative abundance of each metabolite class. (B) PCA score plot. (C) OPLS-DA 2D score plot. (D) Results of the permutation test. (E) Volcano plot of OPLS-DA model. The threshold value for differential metabolite selection is VIP > 1. (F) Volcano plot of univariate statistics. The threshold value for differential metabolite selection is p < 0.05 and |log2FC| > 0. (G) A Venn plot of differential metabolites from multi-dimensional statistics and univariate statistics. *, p < 0.05; **, p < 0.01; ***, p < 0.001.

