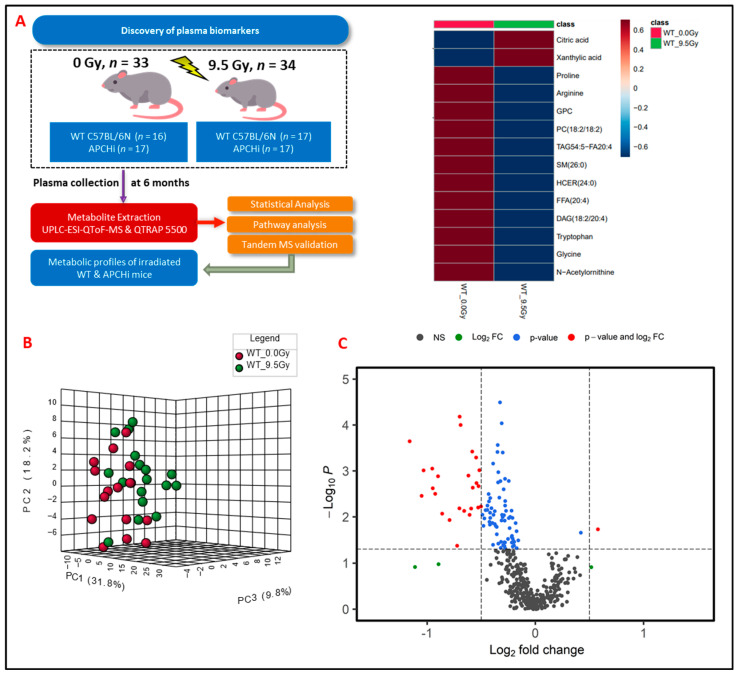
Figure 1.
(A) Experimental and analytical design of the study. Six months post-treatment, plasma samples were gathered from both C57BL/6N and APCHi mice that underwent either irradiation (9.5 Gy of γ-radiation) or sham treatment. These samples then underwent LC-MS-based metabolic profiling to elucidate the delayed metabolic consequences of radiation exposure. (B) A three-dimensional PCA plot showing separation between radiation- and sham-treated groups at six months post-irradiation. (C) Volcano plot displaying dysregulated metabolites in mouse plasma at six months post-irradiation. In the plot, black dots represent metabolites that were not changed significantly; green dots represent metabolites with a significant fold change (1.5); blue dots represent metabolites with a significant p-value (<0.05); and red dots are used to annotate metabolites with a fold change of at least 1.5 as well as p < 0.05.

