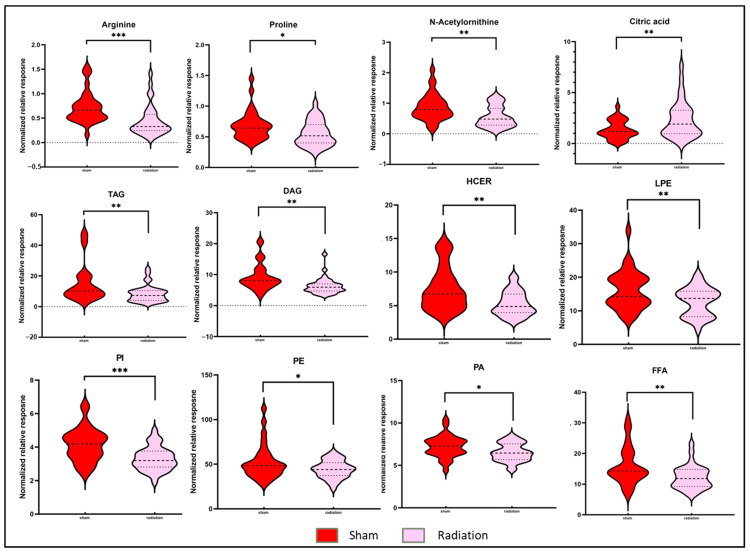
Figure 2.
Radiation modulated plasma metabolic profiles six months after exposure. Violin plots illustrating the abundance of broad classes of lipids and small molecules between C57BL/6N mice in the sham condition and C57BL/6N mice in the irradiated condition six months post-irradiation. The dotted lines represent statistical markers: the center line represents the median, while the top and bottom lines represent the third and first quartiles, respectively. *: p ≤ 0.05, **: p ≤ 0.01 and ***: p ≤ 0.001.

