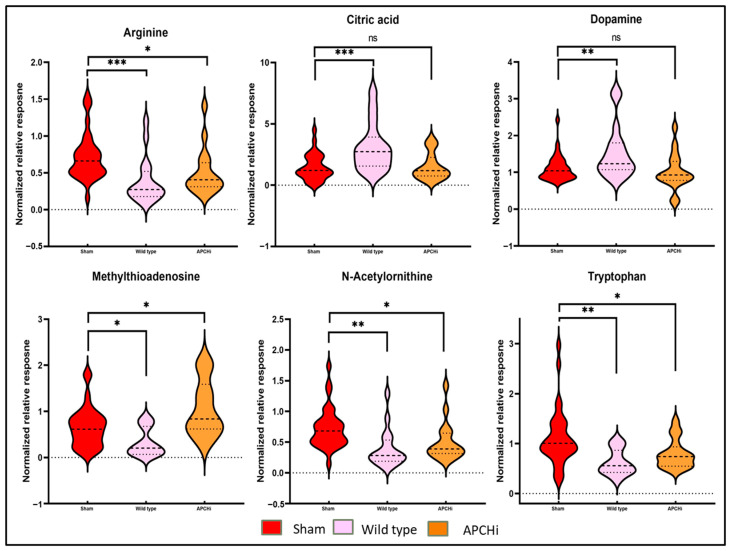
Figure 5.
Mitigation of radiation toxicity in APCHi mice. Metabolic profiles of plasma samples of sham C57BL/6N and APCHi mice (combined for the analysis) were compared to 9.5 Gy of γ-irradiated C57BL/6N and APCHi mice six months post-treatment to see the mitigation effect of radiation toxicity by APC. LC-MS-based metabolic profiles of six selected metabolites are illustrated as Violin plots. The violin plots show a normalized relative abundance of mentioned metabolites between the sham condition, the C57BL/6N group, and the APCHi group 6 months post-irradiation. The dotted lines represent statistical markers: the center line represents the median, while the top and bottom lines represent the third and first quartiles, respectively. ns: p > 0.05, *: p ≤ 0.05, **: p ≤ 0.01, and ***: p ≤ 0.001.

