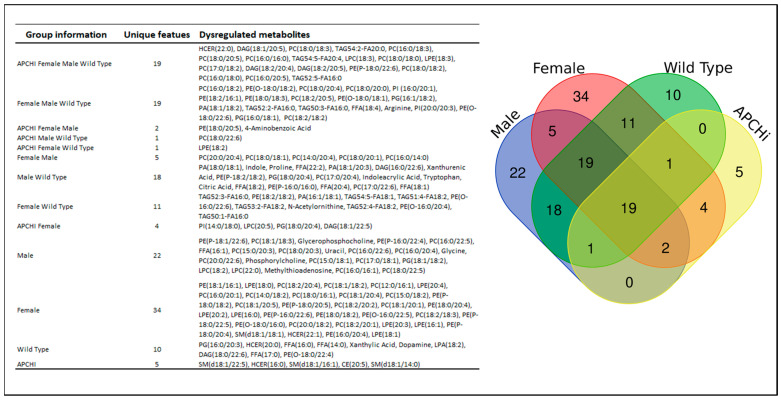
Figure 6.
C57BL/6N WT (n = 20 males and n = 13 females) and transgenic APCHi mice (n = 17 males and n = 17 females) were subjected to γ-radiation at a single dose of 9.5 Gy. Plasma samples were obtained at 6 months after IR exposure and subjected to LC-MS-based metabolomic profiling. Gender- and genotype-dependent binary comparisons were performed between the metabolic profiles of the 9.5 Gy irradiated group with the respective sham irradiated animals and were summarized as a Venn diagram for unique radiation-induced metabolic changes specific to each gender and genotype.

