Figure 3.
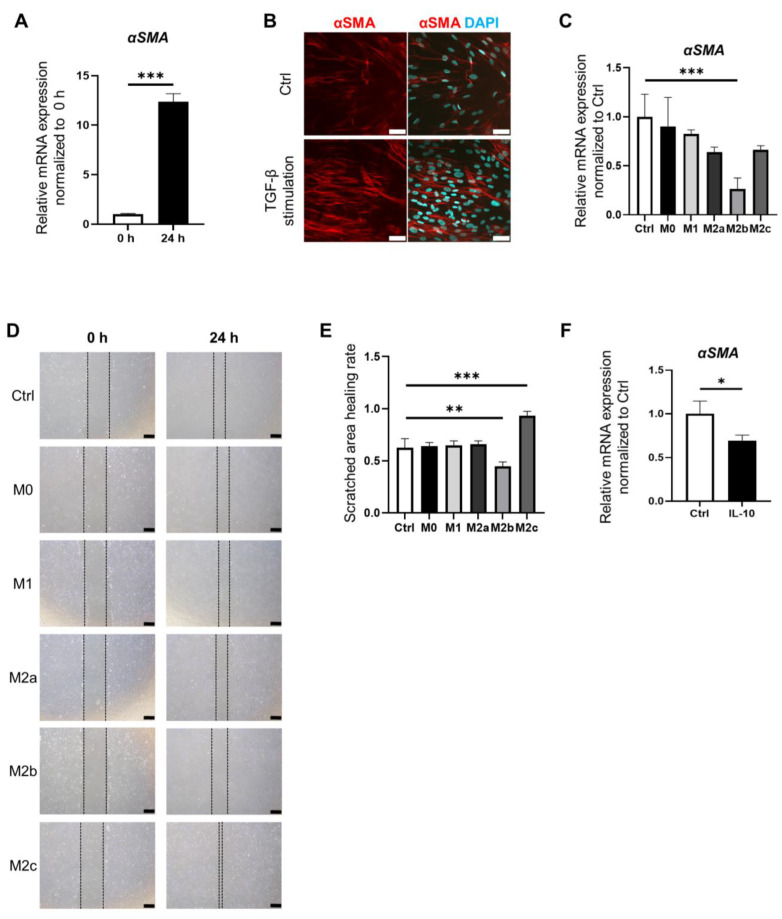
Macrophage subtypes modulate intestinal fibrosis. (A). IMFs were activated by stimulation with TGF-β for 24 h. Relative expression of αSMA mRNA in IMFs at 0 h and 24 h. Relative expression of αSMA mRNA in IMFs was significantly increased at 24 h compared with 0 h (p < 0.001); mean ± SD; n = 3. Statistical analysis was performed using two-tailed Student’s t-test; *** p < 0.001. (B). Immunofluorescence staining for αSMA (red) in control IMFs and IMFs stimulated with TGF-β for 24 h. Nuclei were counterstained with DAPI (blue). Scale bars: 50 µm. (C). IMFs were cultured with a conditioned medium prepared from the culture supernatant of each macrophage subtype. The expression of αSMA was significantly decreased in IMFs cultured with M2b medium compared with the control (blank; RPMI with 1% FBS) (p < 0.001); mean ± SD; n = 3. Statistical analysis was performed using two-tailed Dunnett’s test; *** p < 0.001. (D). Macroscopic images at 0 h and 24 h of scratch-wound healing assay results. IMFs were cultured with conditioned medium prepared from culture supernatant of each macrophage subtype. Scale bars: 500 µm. (E). Scratched area healing rate of scratch-wound healing assay. Scratched wound area was measured at 0 h and 24 h. Scratched area healing rate was calculated as (scratched area at 0 h—scratched area at 24 h)/(scratched area at 0 h) using ImageJ software 1.54. The scratched area healing rate was significantly decreased in IMFs cultured with the M2b medium compared with the control (p < 0.05). The scratched area healing rate was significantly increased in IMFs cultured with M2c medium compared with the control (p < 0.01); mean ± SD; n = 3. Statistical analysis was performed using two-tailed Dunnett’s test; ** p < 0.01, *** p < 0.001. (F). Relative expression of αSMA mRNA in IMFs supplemented with IL-10. The expression of αSMA was significantly decreased in IMFs supplemented with IL-10 compared with the control (p < 0.05). mean ± SD; n = 3. Statistical analysis was performed using two-tailed Student’s t-test; * p < 0.05. Ctrl: control.

