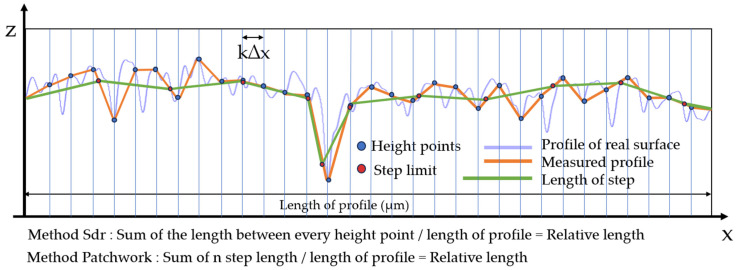
Figure 7.
Diagrams of the two calculation methods used in this study for the developed length. The blue line is a representation of a real surface. The orange line is a linear interpolation between measured height points which is our measured profile (the Sdr method was used for computing the relative length at the sampling scale). The green line is a representation of the Patchwork method following the measured profile using the same length steps and sometimes interpolating between measured height points.

