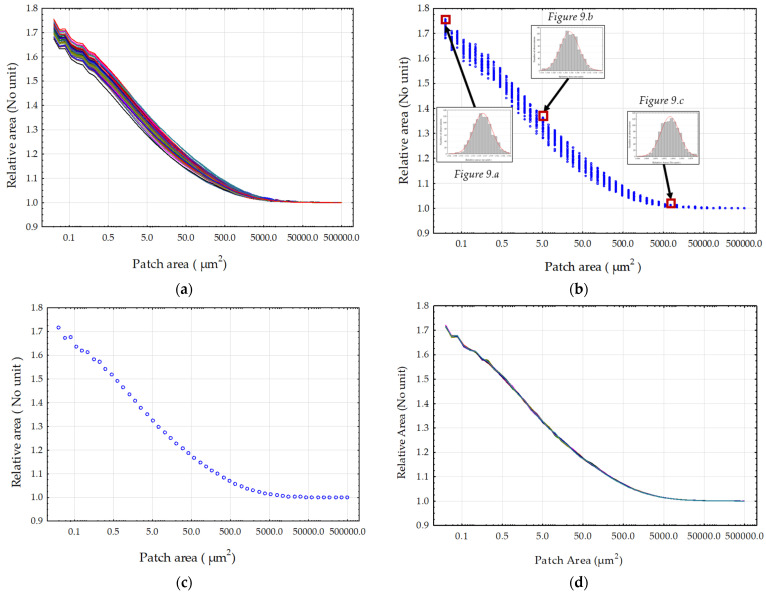
Figure 10.
Distributions of the relative area values calculated by the Patchwork method from the 50 measurements of the sample sandblasted at 8 bar with C 300: (a) the lines of the 50 sample measurements, (b) the values after resampling by bootstrapping, (c) the averages of the original measurements and (d) the averages of the bootstrapped values.

