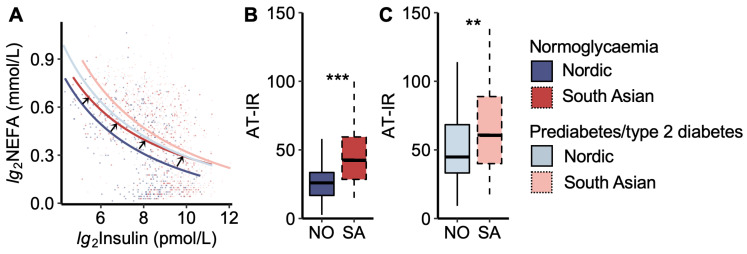
Figure 2.
Adipose tissue insulin resistance index. (A) Plasma non-esterified fatty acid (NEFA) vs. insulin concentrations during the oral glucose tolerance test. The black arrows indicate that the curve for normoglycaemic South Asians is shifted upwards to the right compared to normoglycaemic Nordics, approaching the curves for the prediabetes/type 2 diabetes groups. The coloured dots represent each women. (B) The adipose tissue insulin resistance index (AT-IR), the product of fasting NEFA and insulin levels, in normoglycaemic women and (C) women with prediabetes/type 2 diabetes. NO = Nordic. SA = South Asian. Box plots show medians, 25–75 percentiles, and min/max ranges. ** p < 0.01, and *** p < 0.001 ethnic group difference.

