Figure 3.
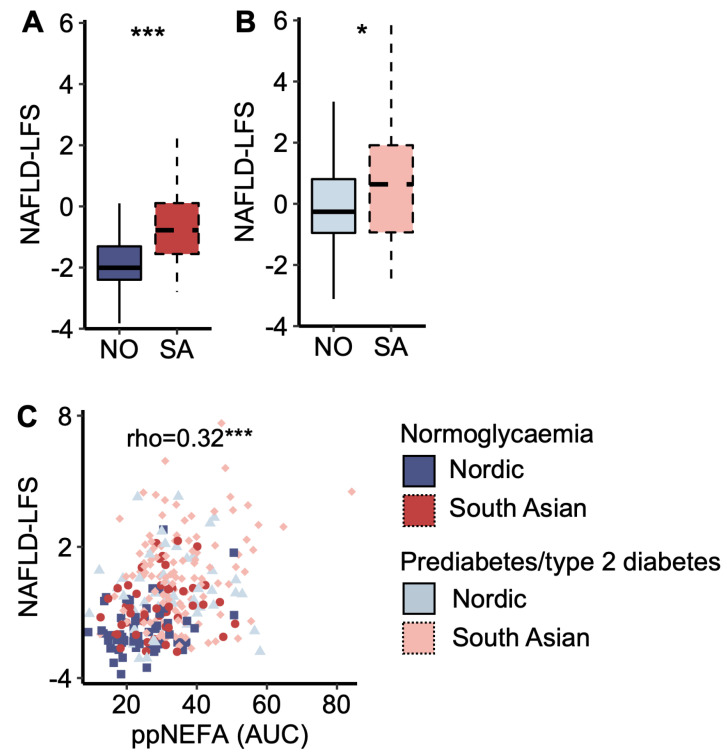
A marker of liver fat content. (A) The non-alcoholic fatty liver disease liver fat score (NAFLD-LFS) in Nordic and South Asian women with normoglycaemia and (B) prediabetes/type 2 diabetes. (C) A scatter plot of NAFLD-LFS scores and post-prandial (pp) non-esterified fatty acid (NEFA) concentration (area under the curve (AUC) from the oral glucose tolerance test (OGTT)). * p < 0.05 and *** p < 0.001. Box plots show medians, 25–75 percentiles, and min/max ranges. NO = Nordic. SA = South Asian.

