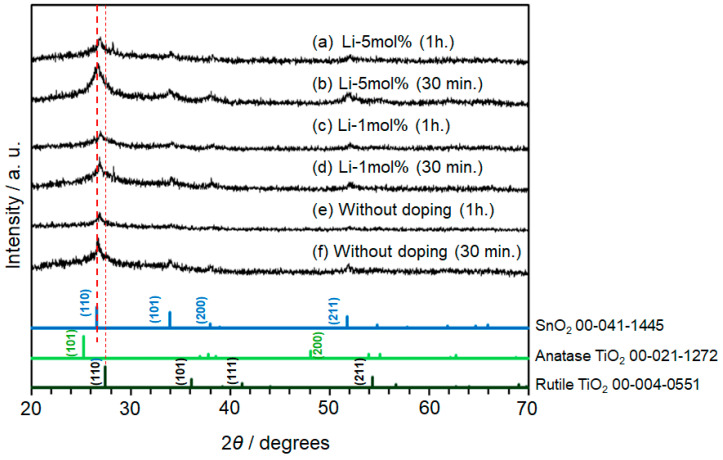
Figure 3.
XRD patterns of the sintered samples of SnO2-based solid solution with TiO2 are shown in (a–d). Non-doped samples are presented as a control experiment in (e,f). The database of SnO2 and TiO2 (anatase and rutile) is also provided at the bottom. For the XRD patterns in (a–d), the Li-dopant rates were 1 mol% and 5 mol%, and the hold time of heating were 30 min and 1 h. Red dotted lines are shown for clarity.

