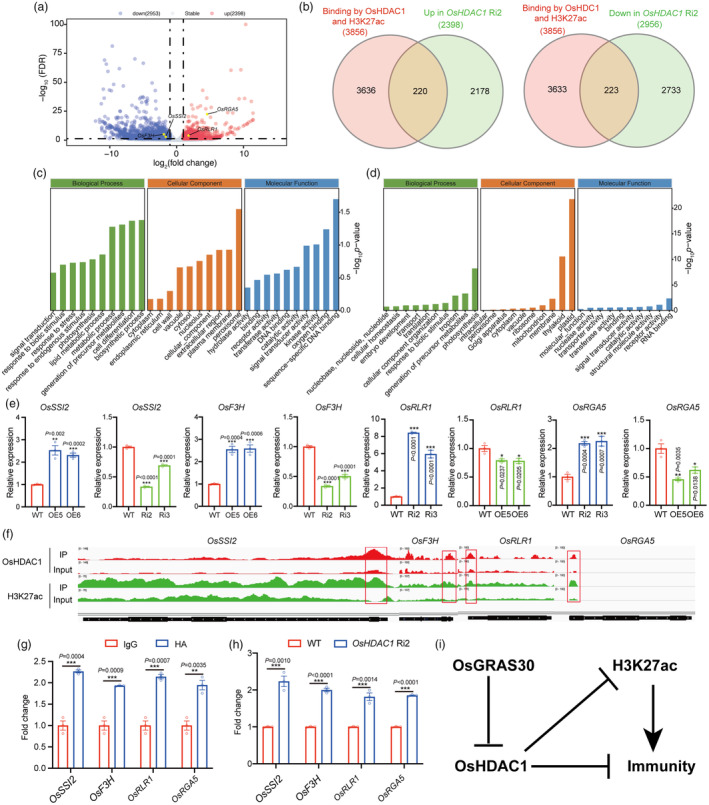
Figure 7.

OsHDAC1 regulates the expression of blast resistance‐related genes. (a) Volcano plot showing differentially expressed genes (DEGs) associated with OsHDAC1 in the OsHDAC1 Ri2 line compared with the WT. (b) Venn diagram showing overlap of DEGs in the OsHDAC1 Ri2 line, OsHDAC1 binding genes and H3K27ac enrichment genes. (c) Go results showing the related biological pathway enriched from downregulated DEGs in OsHDAC1 Ri2 line compared with WT. (d) Go results showing the related biological pathway enriched from upregulated DEGs in OsHDAC1 Ri2 line compared with WT. (e) The transcript level of blast resistance‐related genes in OsHDAC1 OE and RNAi lines compared with WT. Total RNA was extracted from two‐week‐old rice leaves and subjected to RT–qPCR. Expression levels of genes in the WT were set to 1.00. Values are mean ± SEM (n = 3). Experiments were repeated three times with similar results. (f) IGV views showing OsHDAC1 and H3K27ac enrichment in blast resistance‐related genes. Input serves as the negative control. (g) ChIP‐qPCR results of OsHDAC1 binding levels at blast resistance‐related genes in OsHDAC1 OE plants. ChIP‐qPCR results of IgG binding levels of genes were set to 1.00. Values are mean ± SEM (n = 3). Experiments were repeated three times with similar results. (h) ChIP‐qPCR results of H3K27ac levels at blast resistance‐related genes in OsHDAC1 Ri2 line compared with WT plants. ChIP‐qPCR results of H3K27ac levels of genes in the WT were set to 1.00. Values are mean ± SEM (n = 3). Experiments were repeated three times with similar results. Asterisks mark significant changes compared with WT (e and h) or IgG (g) based on Student's t test: *P < 0.05, **P < 0.01, ***P < 0.001. (i) A proposed working model showing the role of OsGRAS30 in manipulating the OsHDAC1‐mediated broad‐spectrum blast resistance in rice. WT, wild‐type; Ri, RNA interference; OE, overexpression.
