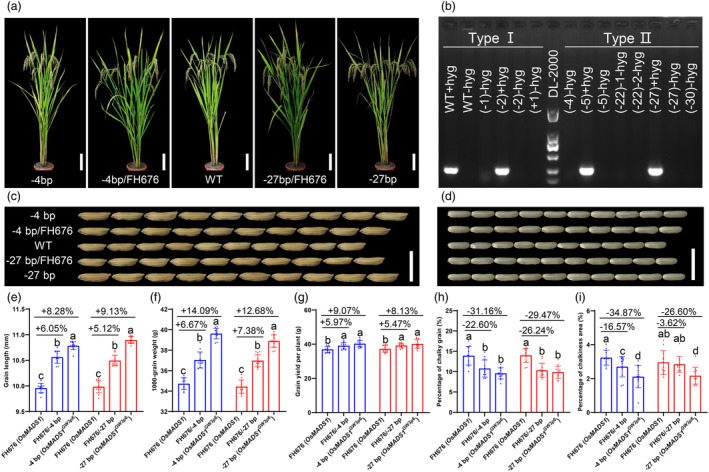
Figure 3.

The phenotype of grain size and quality in FH676 transgene‐free plants. (a) Comparison of plant morphology in BC2F2 plants. Scale bars = 20 cm. (b) PCR amplicons of hyg resistance gene in BC2F2 and T2 plants. All positive plants with the hyg‐B‐resistance gene are conducted in T2 lines. (c–i) Grain morphology (c), brown rice (d), grain length (e), TGW (f), grain yield per plant (g), percentage of chalky grain (h), and chalkiness area (i) in FH676 and BC2F2 plants with the heterozygous and homozygous genotypes of Type II. The letters in parentheses represent the same mRNA as OsMADS1 and OsMADS1 GW3p6 . Data shown as mean ± s.d. (n = 12 plants). Statistical analyses were performed by Duncan's multiple range tests. The presence of the same lowercase letter denotes a non‐significant difference between means (P > 0.05).
