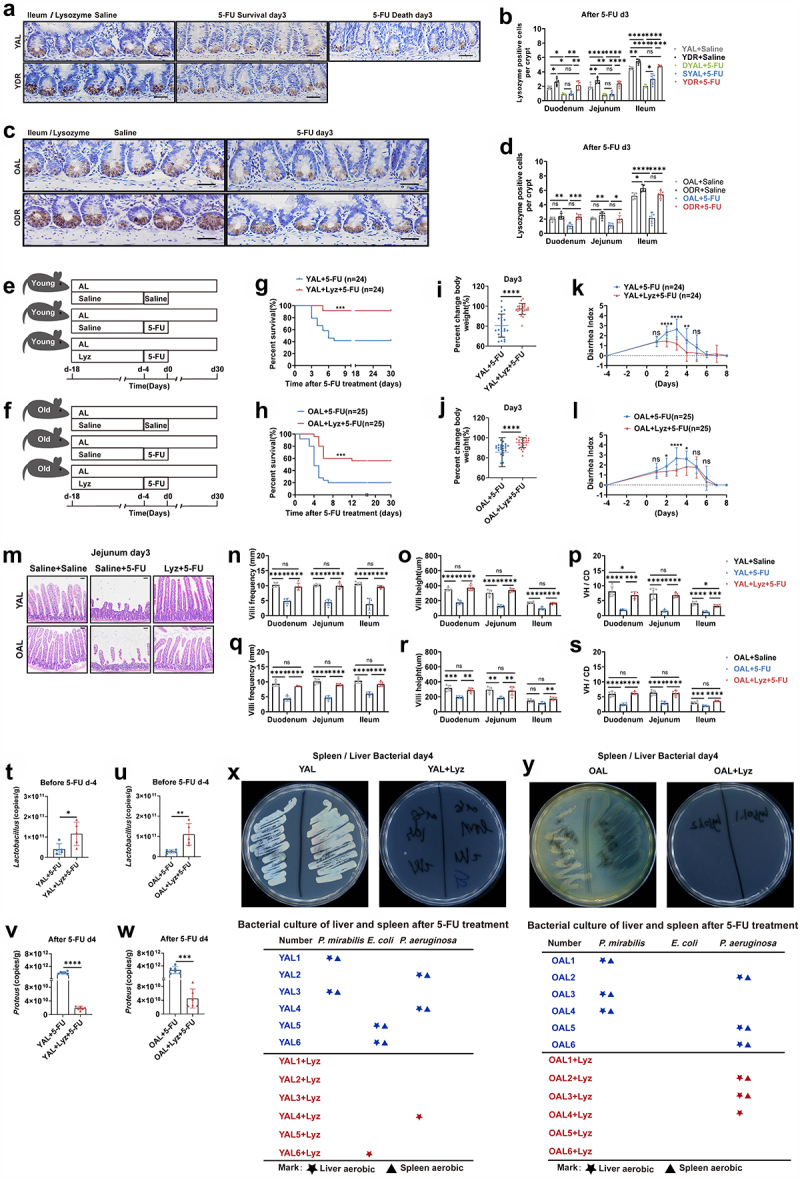
Figure 9.

DR protects intestinal chemical barrier from 5-FU and lysozyme gavage partially rescues survival of AL mice exposed to 5-FU.
(A-D)Young mice (2-month-old) and old mice (20–24-month-old) were exposed to AL diet or DR for 14 days before intraperitoneal 5-FU injection which was daily performed for 5 days, and the diet regimen was continued afterward. For the control group, saline was injected instead of 5-FU. Small intestinal tissue were collected on day 3 after 5-FU treatment for immunohistochemistry staining of Lysozyme. (A,C) Representative images of ileum. Scale bar: 20 μm. (B,D) Statistic analysis of number of Lysozyme-positive cells per crypt in indicated fractions of indicated groups (n = 5 mice per group randomly picked from 2 independent experiments).
(E,F) Scheme of experiments. (E) Young mice (2-month-old) and (F) old mice (20–24-month-old) were treated with lysozyme by gastric gavage for 2 weeks before 5-FU treatment. Then, intraperitoneal 5-FU or saline (control) injection was daily performed for 5 days (day -4,day 0). In the young group: data were combined from 3 independent experiments (n = 24 mice per group for the AL + 5-FU group and AL+Lyz +5-FU group). In the old group: data were combined from 3 independent expriments (n = 25 mice per group for the AL + 5-FU group and AL+Lyz +5-FU group). And the intestines were collected for further analysis (n = 5 mice per group randomly picked from 2 independent experiments).
(G,H) Survival was monitored daily after 5-FU treatment.
(I,J) Percent change of body weight on day 3 after 5-FU treatment.
(K,L) Bowen scoring system determined diarrhea score indexes from indicated groups.
(M-S) Small intestines were collected for further analysis. (M) Representative images of H&E straining of Jejunum on day 3 after 5-FU treatment. Scale bar: 50 μm. (N-S) Villi frequencies, villi height, and VH/CD (the ratio of villi height versus crypt depth) (n = 5 mice per group randomly picked from 2 independent experiments).
(P,Q) Mice were sacrificed on day4 after 5-FU treatment and liver and spleen were collected and homogenized for bacterial culture and further analysis. Representative pictures of bacteria culture dishes from indicated groups were shown. The bacterial colonies grown out from the liver and spleen homogenates were identified by mass spectrometer. The bellowing tables show bacterial species identified from colonies grown out from individual mouse tissue homogenates (n = 6 mice per group from 2 independent experiments).
(T-W) Fecal samples were randomly collected before (day -4) and after (day 4) 5-FU treatment. The amounts of Lactobacillus and Proteus were determined by qPCR analysis of (n = 6 mice per group from 2 independent experiments).
(G,H) Gehan-Breslow-Wilcoxon test; (I-L,T-W) Unpaired two-tailed, Student’s t test; (B,D,N-S) One-way ANOVA test. Results were displayed as mean±SD. *p < .05; **p < .01;***p < .001; ****p < .0001; ns, not significant.
