
Figure 3:
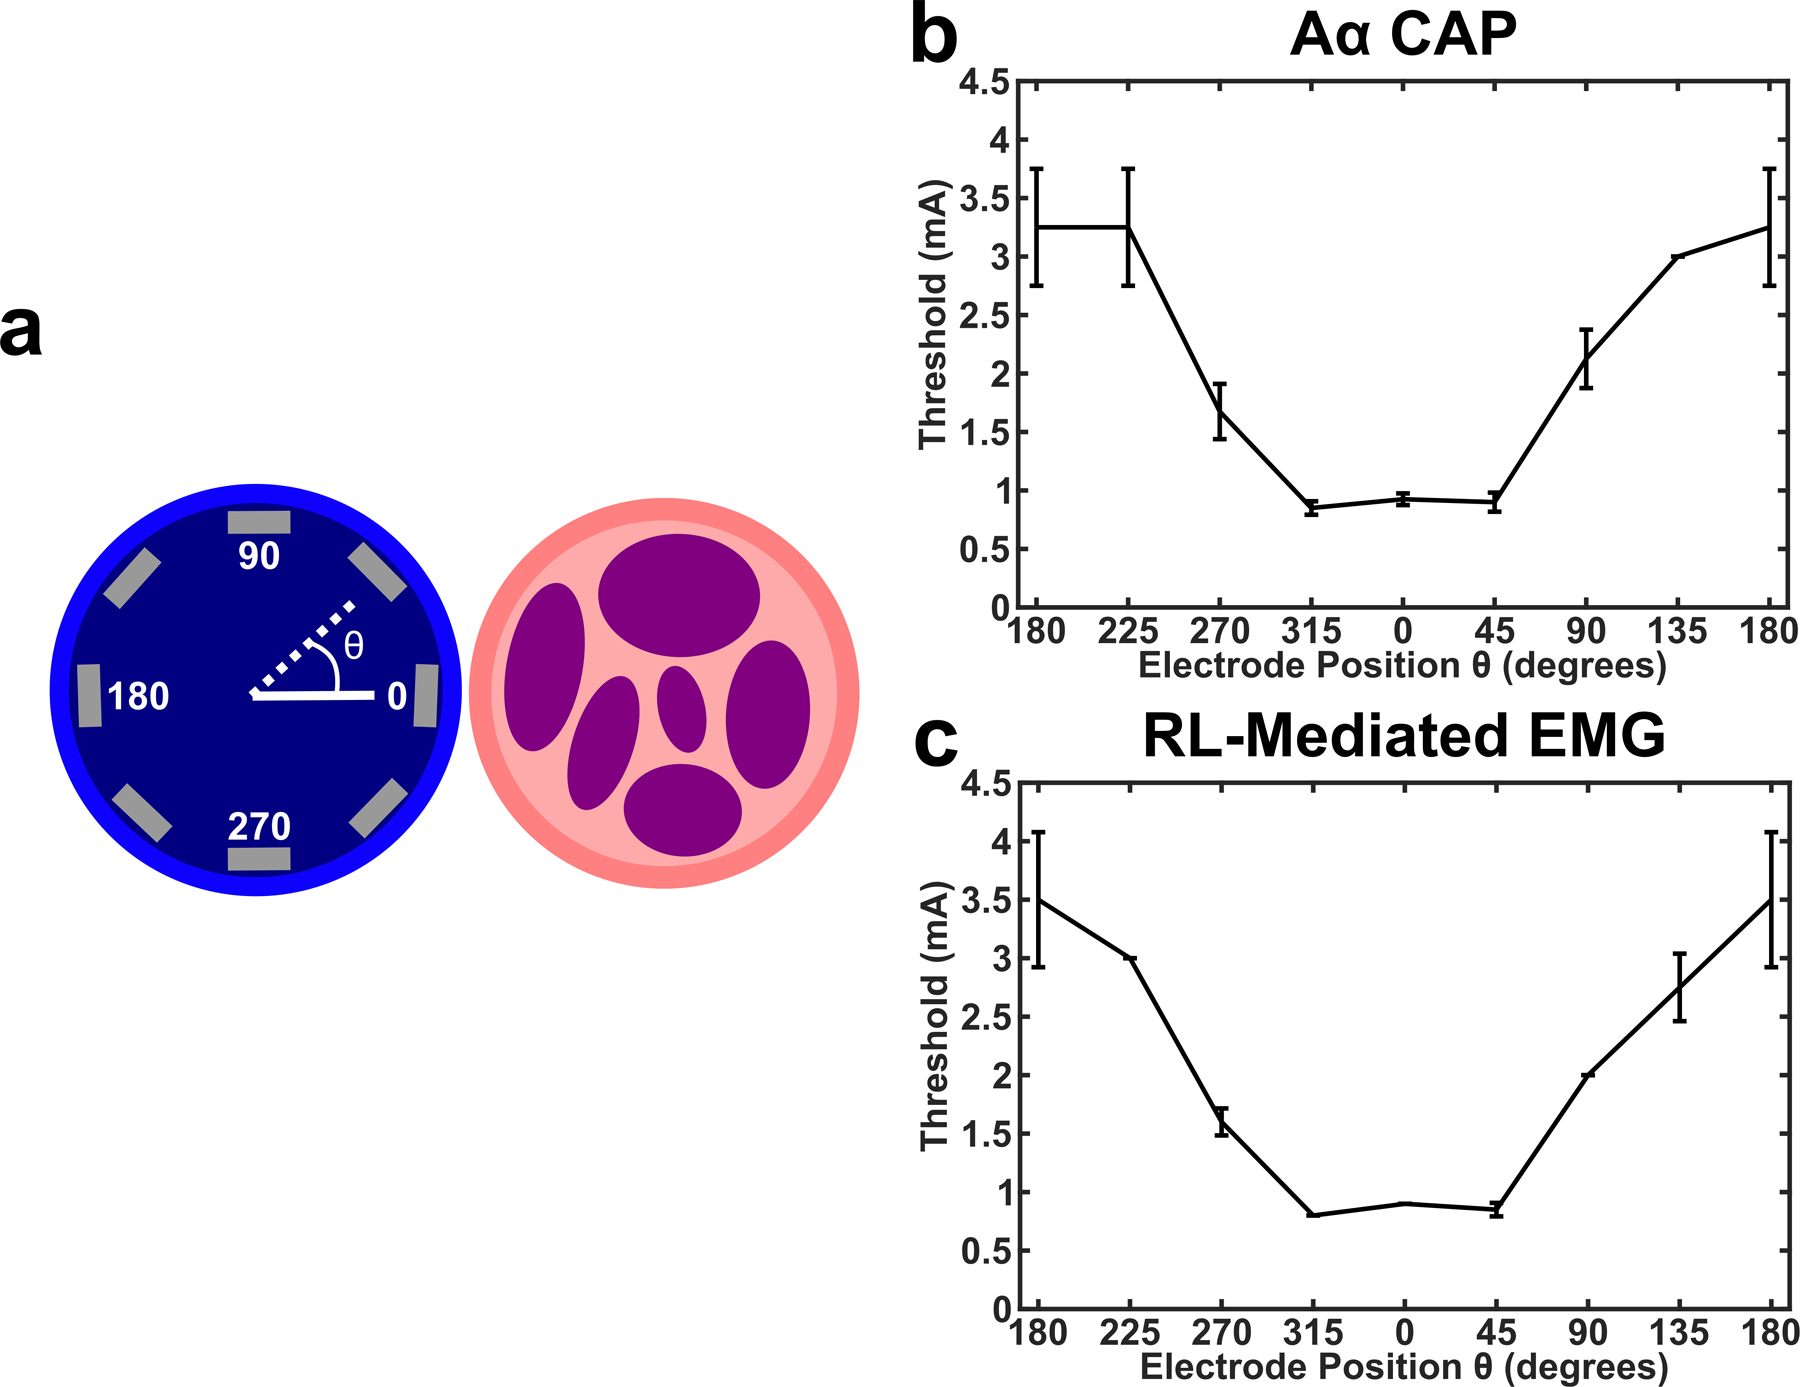
Endovascular circumferential electrode array and VNS activation demonstrating that electrode position within vein is critical for optimal activation of the nerve. a) Cartoon shows the internal jugular vein as the blue circle (left), vagus nerve trunk as the pink circle (right), and the 8 electrode contacts as the gray rectangles. Position of stimulation electrode contacts were verified with postmortem dissection, and data from each animal was binned such that the electrode closest to the VN were labeled as θ = 0. b) Thresholds for activation of the Aα CAP in response to monopolar stimulation at each of the 8 contacts in one animal (n = 4 LIFE electrodes, black line is mean, error bars are standard deviation). c) Same as b, but for RL-mediated EMG (n = 2 needle electrodes, black line is mean, error bars are standard deviation).