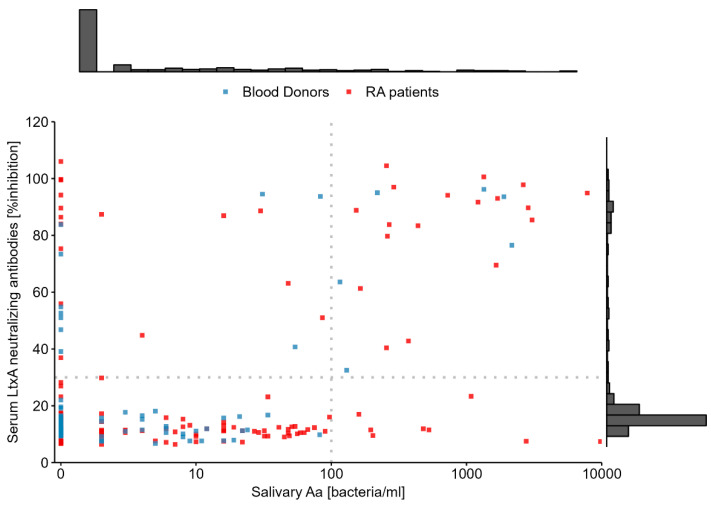
Figure 1.
Relationship between salivary Aa and systemic LtxA ab in patients with RA (red points) and healthy blood donors (blue points). Salivary Aa is presented on the natural log scale with a constant of one added to zero values before transformation. The dotted lines mark the detection limit for each variable, and each variable´s distribution is illustrated by the marginal histograms.

