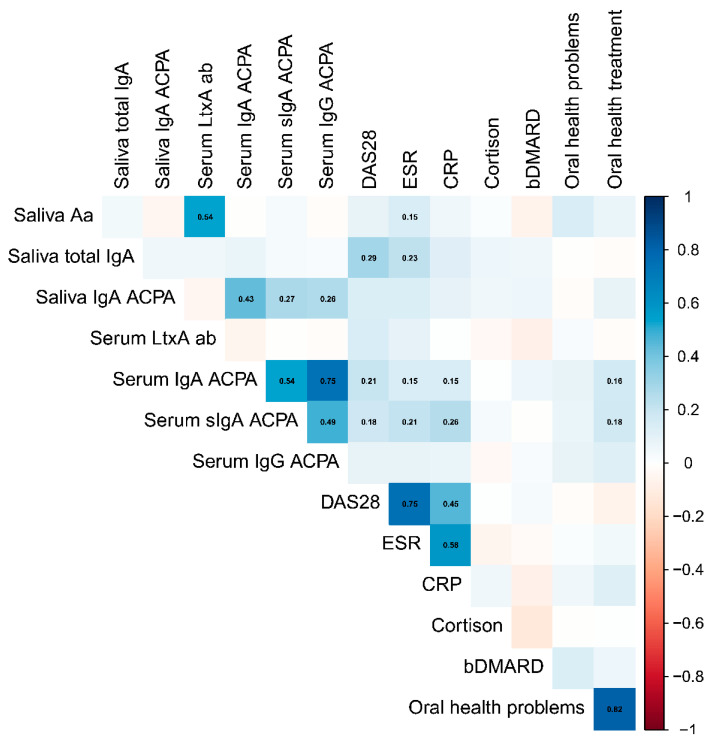
Figure 2.
Plot of monotonic correlations between Aa markers and RA-associated parameters based on data left censored at the detection level. Blue color and red color indicate positive and negative correlations, respectively. Point estimates shown for correlations significant at 0.05 level only. The different parameters are described in material and methods (Section 2.1,Section 2.2 and Section 2.3).

